读书笔记《developing-java-applications-with-spring-and-spring-boot-ebook》健康监测和数据可视化
在本章中,我们将介绍以下食谱:
- Writing custom health indicators
- Configuring management context
- Emitting metrics
- Monitoring Spring Boot via JMX
- Managing Spring Boot via SSHd Shell and writing custom remote Shell commands
- Integrating Micrometer metrics with Graphite
- Integrating Micrometer metrics with Dashing
在前一章中,您学习了一些有效打包和准备部署应用程序的技术,我们研究了一些在不更改代码的情况下提供环境配置的技术。随着部署和配置问题的结束,最后(但并非最不重要的)重要步骤仍然存在——确保我们对我们的应用程序具有完全的可见性、监控和管理控制,因为它在生产环境中运行并暴露在严酷的环境中客户(ab)使用环境。
就像航空公司的飞行员不喜欢盲目飞行一样,如果开发人员看不到他们心爱的应用程序(他们努力开发的应用程序)在生产中的表现,他们也不会感到兴奋。我们想知道,在任何给定时间,CPU 利用率是什么样的,我们消耗了多少内存,我们与数据库的连接是否可用,在任何给定时间间隔内使用系统的客户数量,以及很快。我们不仅想了解所有这些事情,而且还希望能够在漂亮的图表、图形和可视仪表板中看到它。这些非常方便放在大型等离子显示器上进行监控并给您的老板留下深刻印象,从而表明您处于领先地位并且一切都在掌控之中。
本章将帮助您学习必要的技术来增强我们的应用程序以公开自定义指标、健康状态等,以及如何从我们的应用程序中获取监控数据并将其存储在 Graphite 中以供历史参考或使用这些数据使用 Dashing 和 Grafana 框架创建实时监控仪表板。我们还将了解使用强大的 CRaSH 框架集成连接到正在运行的实例和执行各种管理任务的能力。
了解在生产中运行的应用程序的状态,尤其是在大规模分布式系统中,就像(如果不是更多)重要的是拥有诸如自动化测试和部署之类的东西。在当今快节奏的 IT 世界中,我们真的无法承受太多停机时间,因此我们需要触手可及的有关应用程序运行状况的信息,随时准备就绪。如果最重要的数据库连接出现故障,我们希望立即看到它并能够快速修复这种情况;客户在前往另一个站点之前不会等待很长时间。
我们将继续处理我们的 BookPub 应用程序,使其处于我们在上一章中离开的状态。在这个秘籍中,我们将添加必要的 Spring Boot 启动器来启用我们的应用程序的监控和检测,甚至会编写我们自己的健康指标。
- The first thing that we need to do is add a dependency to the Spring Boot Actuator starter in our
build.gradlefile with the following content:
- Adding this dependency alone already gives us the ability to access the Spring management
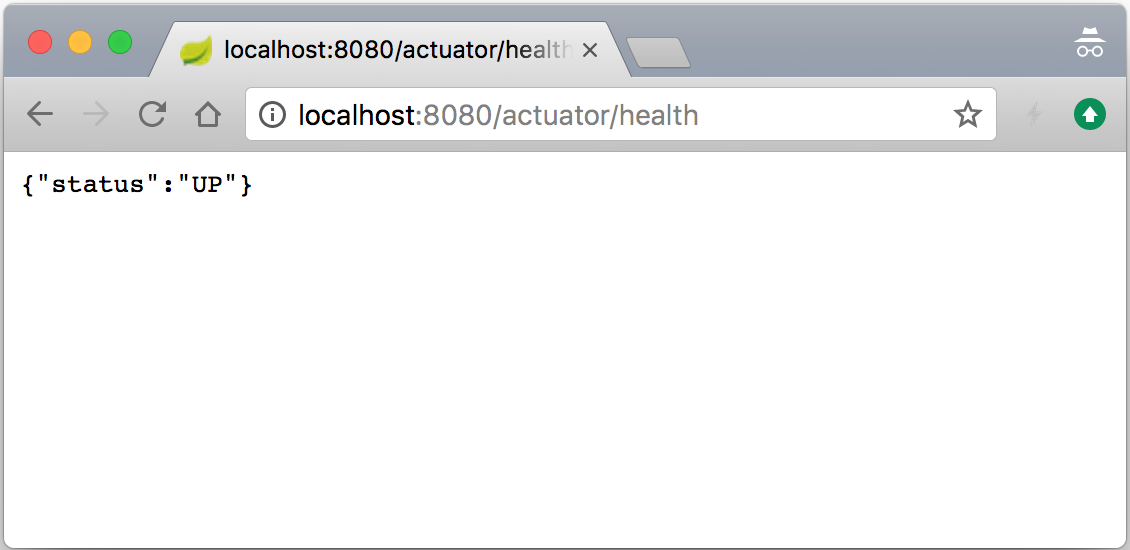
/actuator/*endpoints, such as/env,/info,/metrics, and/health, (though they are disabled by default, unless amanagement.endpoints.web.exposure.include=*property is configured in theapplication.propertiesfile). So, let's start our application by executing the./gradlew clean bootRuncommand line and then we can access the newly available/healthendpoint by opening our browser and going tohttp://localhost:8080/actuator/healthso as to see the new endpoint in action, as shown in the following screenshot:
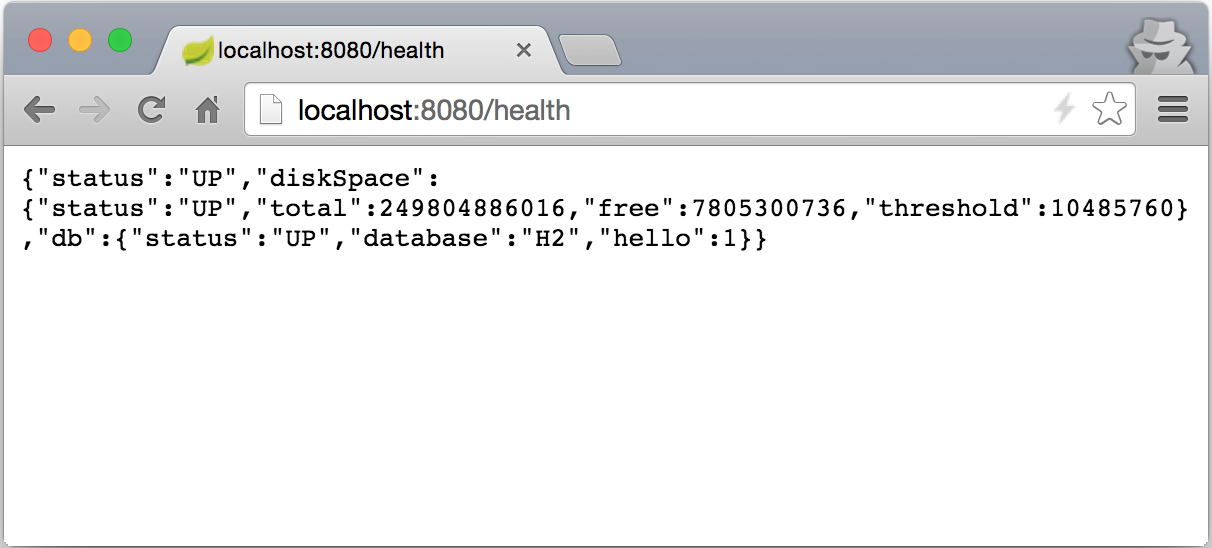
- To get more details about the health state of our application, let's configure it to show the detailed health output by adding the
management.endpoint.health.show-details=alwaysproperty to theapplication.propertiesfile and then restarting our application. Now, when we go tohttp://localhost:8080/actuator/healthin the browser, we should see something similar to the following screenshot:
- With the
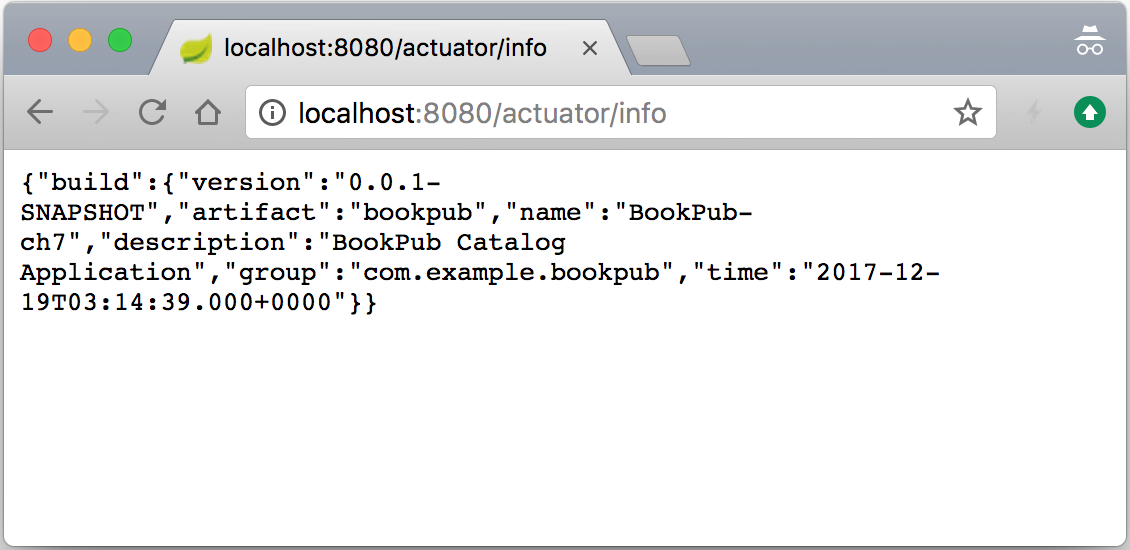
actuatordependency added, and detailed/healthendpoint configured, we can now add and perform all kinds of monitoring functions on our application. Let's go ahead and populate the/infoendpoint with some data by adding a directive to thebuild.gradlefile located at the root of our project with the following content:
- Next, we will create a new properties file named
gradle.propertiesin the root directory of our project with the following content:
- We will also add
rootProject.name='BookPub-ch7'to thesettings.gradlefile located in the root directory of our project. - Now, let's start our application by executing
./gradlew clean bootRunand then we can access the newly available/infoendpoint by opening our browser and going tohttp://localhost:8080/actuator/infoto see the new endpoint in action, as follows:
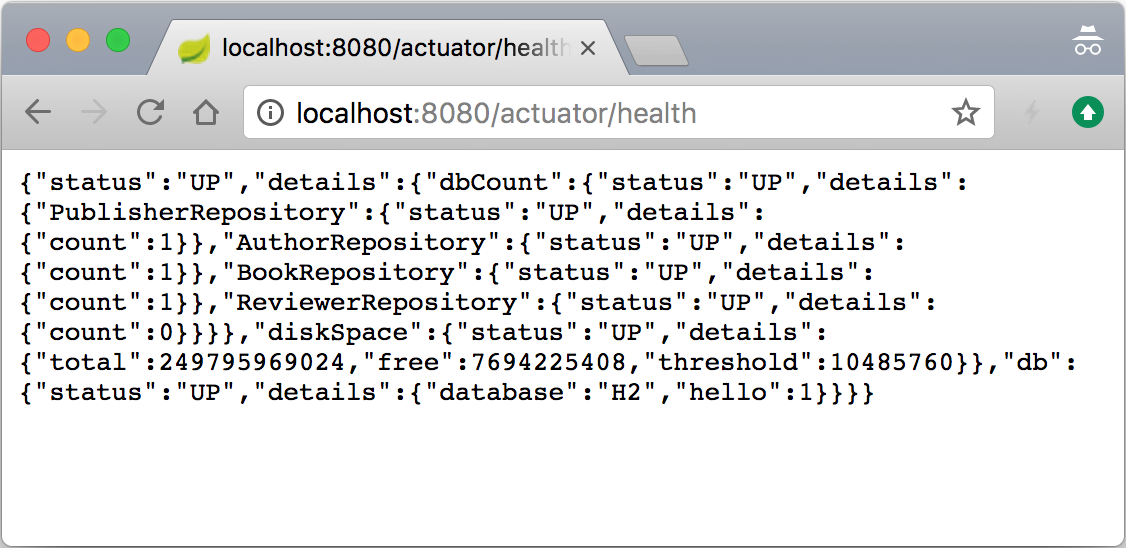
- As we have got the hang of how things work, let's go ahead and make our custom health indicator, which will be accessible via the
/healthendpoint in order to report the count status of the entries for each of our repositories. If they are greater than or equal to zero, we areUP, otherwise we are not really sure what's going on. Obviously, if an exception has occurred, we would be reportingDOWN. Let's start by relaxing thegetRepositoryName(...)method visibility fromprivatetoprotectedin theDbCountRunner.javafile located in thedb-count-starter/src/main/java/com/example/bookpubstarter/dbcountdirectory at the root of our project. - Next, we will add the same dependency to the
compile("org.springframework.boot:spring-boot-starter-actuator")library in thebuild.gradlefile in thedb-count-starterdirectory at the root of our project.
- Next, we will modify the
@Importannotation in theEnableDbCounting.javafile located in thedb-count starter/src/main/java/com/example/bookpubstarter/dbcountdirectory at the root of our project with the following content:
- Finally, for the automatic registration of our
HealthIndicatorclass, we will enhance theDbCountAutoConfiguration.javafile located in thedb-count-starter/src/main/java/com/example/bookpubstarter/dbcountdirectory at the root of our project with the following content:
Spring Boot Actuator starter 添加了许多重要功能,可以深入了解应用程序的运行时状态。该库包含许多自动配置,用于添加和配置各种端点以访问运行时监控数据和应用程序的运行状况。这些端点都共享一个共同的上下文路径:/actuator。要公开除 /info 和 /health 之外的任何其他端点,我们需要通过设置 management.endpoints.web.exposure.include=* 属性。当该值设置为 * 时,它将公开所有端点。以下端点可帮助我们深入了解应用程序运行时状态和配置:
/env: This endpoint enables us to query the application about all of the environment variables that the application has access to via the environment implementation, which we have seen earlier. It is very useful when you need to debug a particular issue and want to know a value of any given configuration property. If we access the endpoint by going tohttp://localhost:8080/actuator/env, we will see a number of different configuration sections, for example, the class path resource[tomcat.https.properties],applicationConfig: [classpath:/application.properties],commonsConfig,systemEnvironment,systemProperties, and others. They all represent an instance of an individualPropertySourceimplementation that is available in the environment and depending on their place in the hierarchy, may or may not be used to provide the value resolution at the runtime. To find out exactly which entry is used to resolve a particular value, for example, for thebook.count.rateproperty, we can query it by going to thehttp://localhost:8080/actuator/env/book.counter.rateURL. By default, we should get 10,000 as a result unless, of course, a different value was set via the system environment or command-line arguments as an override. If you really want to dig deep into the code, theEnvironmentEndpointclass is responsible for handling the logic behind this capability./configprops: This endpoint provides you with an insight into the settings of the various configuration property objects, such as ourWebConfiguration.TomcatSslConnectorPropertiesstarter. It is slightly different from the/envendpoint as it provides insight into the configuration object bindings. If we open the browser to go tohttp://localhost:8080/actuator/configpropsand search forcustom.tomcat.https, we will see the entry for our configuration property object that we will use to configureTomcatSslConnector, which was automatically populated and bound for us by Spring Boot./conditions: This endpoint serves as a web-based analog to the AutoConfiguration Report, which we saw in Chapter 23, Writing Custom Spring Boot Starters. This way, we can get the report using the browser at any time without having to start the application with the specific flags to get it printed./beans: This endpoint is designed to list all the beans that have been created by Spring Boot and are available in application context./mappings: This endpoint exposes a list of all the URL mappings that are supported by the application as well as a reference to theHandlerMappingbean implementation. This is very useful for answering the question of where would a specific URL get routed to. Try going tohttp://localhost:8080/actuator/mappingsto see the list of all the routes that our application can handle./threaddump: This endpoint allows extraction of the Thread Dump information from the running application. It is rather useful when trying to diagnose a potential thread deadlock./heapdump: This endpoint is similar to/dumpwith the exception that it produces Heap Dump information instead./info: This endpoint shows the basic description and application information that we added and we've seen this in action, so it should be familiar to us as of now. The nice support in the build tools gives us the ability to configure additional or replace existing values inside ourbuild.gradleconfiguration, which would then be propagated to be consumed by the/infoendpoint. Additionally, any properties defined in theapplication.propertiesfile, that start withinfo.will be displayed while accessing the/infoendpoint, so you are definitely not limited to only thebuild.gradleconfiguration. Configuring this specific endpoint in order to return the relevant information can be very helpful when building various automated discovery and monitoring tools as it is a great way to expose application-specific information in the form of a nice JSON RESTful API./actuator: This endpoint gives a nice JSON-formatted list of links in a Hypertext Application Language (HAL) style for all the available actuator endpoints./health: This endpoint provides information about the general application health status as well as a detailed breakdown and health status of the individual components./metrics: This endpoint gives an overview of all the various data points that are emitted by the metrics subsystem. You can experiment with it by accessing it via thehttp://localhost:8080/actuator/metricsURL in the browser. We will cover this in more detail in the next recipe.
现在我们大致了解 Spring Boot Actuator 为我们提供了什么,我们可以继续看一下我们为获得自定义 HealthIndicator 类所做的工作的细节Spring Boot 中的整个健康监控子系统如何工作以及如何运作。
如您所见,让基本的 HealthIndicator 接口工作非常容易;我们所要做的就是创建一个实现类,该类将在调用 health() 方法时返回一个 Health 对象。您所要做的就是将 HealthIndicator 类的实例公开为 @Bean 以便 Spring Boot 拾取并添加它到 /health 端点。
在我们的例子中,我们更进一步,因为我们必须处理为每个 CrudRepository 实例创建 HealthIndicator 的需要。为此,我们创建了一个 CompositeHealthIndicator 实例,我们为每个 DbHealthIndicator 实例文字">CrudRepository。然后我们将其作为 @Bean 返回,这就是 Spring Boot 用来表示健康状态的内容。作为一个组合,它保留了内部层次结构,从返回的表示健康状态的 JSON 数据可以看出这一点。我们还添加了一些额外的数据元素来提供条目计数的指示以及每个特定存储库的名称,以便我们可以区分它们。
查看代码,您可能想知道:这是什么HealthAggregator我们已经连接的实例? 我们需要一个 HealthAggregator 实例的原因是因为 CompositeHealthIndicator 需要知道如何决定所有嵌套 HeathIndicators 的内部构成是代表整体健康状况的好坏。想象一下,除了一个之外,所有存储库都返回 UP 但一个是 DOWN。这是什么意思?综合指标整体上是健康的还是应该报告 DOWN 因为一个内部存储库有问题?
默认情况下,Spring Boot 已经创建并使用了 HealthAggregator 的实例,所以我们只是自动装配它并在我们的用例中使用它。我们确实必须明确添加 HealthIndicatorAutoConfiguration 和 MetricsDropwizardAutoConfiguration 类的导入,以满足切片测试期间的 bean 依赖性DataJpaTest 和 WebMvcTest,因为它们仅部分实例化上下文,并且缺少执行器自动配置。
即使默认的 implementation 是 OrderedHealthAggregator 的一个实例,它只是收集所有内部状态响应,并在 DOWN、OUT_OF_SERVICE、UP 和 UNKNOWN,并不总是这样。例如,如果复合指标包含冗余服务连接的指标,那么只要至少有一个连接是健康的,那么您的组合结果可能是 UP。创建自定义HealthAggregator 接口非常简单;您所要做的就是扩展 AbstractHealthAggregator 或实现 HealthAggregator 接口本身。
开箱即用的 Spring Boot Actuator 创建了一组 management 端点和主应用程序上下文中的支持 bean,这些端点是在 server.port 配置的 HTTP 端口上可用。但是,在某些情况下,出于安全或隔离原因,我们希望将主应用程序上下文与管理上下文分开,或者将管理端点暴露在与主应用程序不同的端口上。
Spring Boot 为我们提供了为管理 bean 配置单独的子应用程序上下文的能力,它将继承主应用程序上下文的所有内容,但也允许定义仅可用于管理功能的 bean。这同样适用于在不同的端口上公开端点,甚至使用不同的连接器安全性,这样主应用程序可以使用 SSL,但可以使用纯 HTTP 访问管理端点。
让我们想象一下,无论出于何种原因,我们想要将 JSON 转换器更改为使用 SNAKE_CASE 输出字段名称(所有小写字母用下划线分隔单词)。
- First, let's create a class holding our configuration for the management context named
ManagementConfiguration.javalocated in thesrc/main/java/com/example/bookpubdirectory at the root of our project with the following content:
- We also need to add this class to
spring.factorieslocated in thesrc/main/resources/META-INFdirectory at the root of our project with the following content:
- To avoid our configuration being detected by the component scan for the main application context, we need to exclude it by adding the following to
BookPubApplication.javalocated in thesrc/main/java/com/example/bookpubdirectory at the root of our project:
- Finally, let's start our application by executing
./gradlew clean bootRunand then we can access the/threaddumpendpoint by opening our browser and going tohttp://localhost:8081/actuator/threaddumpto see our new configuration take place. The field names of the returned JSON should all be in lowercase and words should be separated using an underscore, or inSNAKE_CASE, as it is called. Alternatively, by going to thehttp://localhost:8080/books/978-1-78528-415-1endpoint, we should continue seeing JSON field names in theLOWER_CAMEL_CASEformat.
Spring Boot 认识到有很多原因,它需要能够为管理端点和其他执行器组件的工作方式提供单独的配置,这与主应用程序不同。此类配置的第一级可以通过设置无数可用属性来实现,这些属性直观地以 management.* 开头。我们使用了一个这样的属性,management.server.port,将管理接口的端口设置为8081。我们还可以设置诸如 SSL 配置、安全设置或网络 IP 接口地址之类的东西来绑定侦听器。我们还可以通过设置以 management.endpoint.<name>.* 开头的相应属性来配置每个单独的 并有多种设置,具体取决于具体的端点目标。actuator 端点
出于安全原因,各种管理端点暴露的数据,尤其是来自敏感端点的数据,例如 /health、/env
,而其他人对于外部的恶意人员来说可能非常有利可图。为了防止这种情况发生,Spring Boot 为我们提供了配置是否希望端点通过 management.endpoint.<name>.enabled=false 可用的能力。我们可以通过设置适当的 management.endpoint<name>.enabled=false 属性或使用 management.endpoints.web.exposure.exclude=<name> 告诉 Spring Boot 是否应该启用此端点,但不通过 WEB HTTP API 访问方法公开。
或者,我们可以设置 management.server.port=-1 以禁用这些端点的 HTTP 暴露或使用不同的端口号以启用管理端点和实时服务不同的端口。如果我们想通过 localhost 启用访问 only ,我们可以通过配置 management.server.address=127.0.0.1 来阻止外部访问。甚至上下文 URL 路径也可以配置为其他内容,例如 /admin,通过 management.server.context-path=/admin。这样,要访问 /health 端点,我们将转到 http://127.0.0.1/admin/health 而不是默认的 /actuator 上下文路径。如果您想通过防火墙规则控制和限制访问,这会很有用,因此您可以添加一个过滤器来阻止外部访问任何内容,/admin/*,所有来自外部的应用程序。通过添加 Spring Security,还可以将身份验证配置为需要用户登录才能访问端点。
在使用属性控制行为不够的情况下,Spring Boot 提供了一种机制,通过使用 spring.factories 和随附的 ManagementContextConfiguration 注释。这使我们能够告诉 Spring Boot 在创建管理上下文时应该自动加载哪些配置。此注解的预期用途是使配置存在于主应用程序代码之外的单独的、可共享的依赖库中。
在我们的例子中,因为我们把它放在同一个代码库中(为了简单起见),我们不得不做一个额外的步骤,并在 BookPubApplication.java 文件中定义排除过滤器来排除设置主应用程序时组件扫描的 ManagementContextConfiguration 类。我们必须这样做的原因很简单——如果我们查看 ManagementContextConfiguration 注释定义,我们会发现它是一个带有 @Configuration 注释。这意味着当我们的主应用程序被配置时,组件扫描会自动检测应用程序代码的类路径树中所有带有 @Configuration 注释的类,并且因此,它也会将所有标有 ManagementContextConfiguration 的配置放在主上下文中。我们使用排除过滤器避免了这种情况。或者,更好的方法是使用不同的包层次结构将这些配置放在单独的库中,这将阻止组件扫描拾取它们,但由于 spring.factories,自动配置仍然有效 条目告诉 Spring Boot 自动将这些配置添加到 management<一个 id="id325894916" class="indexterm"> 上下文。org.springframework.boot.actuate.autoconfigure.web.ManagementContextConfiguration 的
为了使管理上下文与主应用程序分离,需要使用 management.server.port 属性将其配置为在单独的端口上运行。如果没有此设置,所有对象都将使用共享应用程序上下文。
上一个秘籍概述了 Spring Boot Actuators 提供的功能。我们使用了不同的 management 端点,例如 /info and /health 甚至创建了我们自己的健康指标以添加到默认设置中。但是,除了健康状态之外,作为开发人员和运营人员,我们还希望能够持续查看和监控许多事情,而仅仅知道上行链路功能还不够好。我们还想查看打开会话的数量、对应用程序的并发请求、延迟等。在这个秘籍中,你将了解 Spring Boot 中的指标报告功能,以及如何添加我们自己的指标以及一些快速简单的可视化方法。
To help us visualize the metrics better, we will use a great open source project, spring-boot-admin, located at https://github.com/codecentric/spring-boot-admin. It provides a simple web UI on top of the Spring Boot Actuators to give a nicer view of the various data.
我们将使用 https 中的说明在 Gradle 中创建一个简单的管理应用程序://github.com/codecentric/spring-boot-admin#server-application 通过执行以下简单步骤:
- Go to start.spring.io and create a new application template with the following fields:
Generate a:Gradle ProjectWith:JavaSpring Boot:2.0.0 (SNAPSHOT)Group:org.sample.adminArtifact:spring-boot-admin-webName:Spring Boot Admin WebDescription:Spring Boot Admin Web ApplicationPackage Name:org.sample.adminPackaging:JarJava Version:8
- Select the
Actuatoroption underSearch for dependencies - Click on
Generate Project alt +to download the application template archive - Extract the contents from the directory of your choice
- In the extracted directory, execute the
gradle wrappercommand line to generate a gradlew script - In the
build.gradlefile, add the following dependencies to thedependenciesblock:
- We also need to update the
repositoriesblock with a reference to use thesnapshotsrepository (as the time of writing, the SBA is not yet released):
- Open the
application.propertiesfile located in thesrc/main/resourcesdirectory and add the following settings:
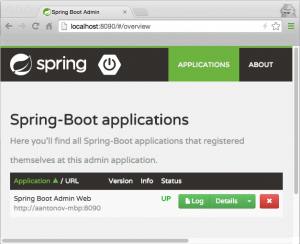
- We are now ready to start our Admin Web Console by running
./gradlew bootRunand open the browser tohttp://localhost:8090to see the following output:
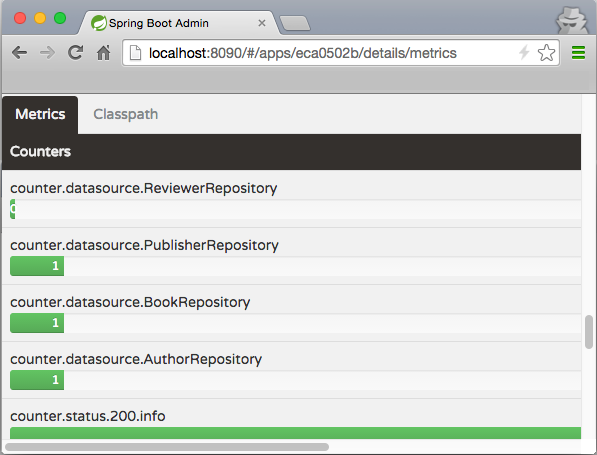
- With the Admin Web up and running, we are now ready to start adding various metrics to our
BookPubapplication. Let's expose the same information about our data repositories as we did inHealthIndicators, but this time, we will expose the counts data as a metric. We will continue to add code to ourdb-count-startersubproject. So, let's create a new file namedDbCountMetrics.javain thedb-count-starter/src/main/java/com/example/bookpubstarter/dbcountdirectory at the root of our project with the following content:
- Next, for the automatic registration of
DbCountMetrics, we will enhanceDbCountAutoConfiguration.javalocated in thedb-count-starter/src/main/java/com/example/bookpubstarter/dbcountdirectory at the root of our project with the following content:
- In order for the Thread Dump to properly display in the Spring Boot Admin UI, we need to change our JSON converter from
SNAKE_CASEtoLOWER_CAMEL_CASEby changingManagementConfiguration.javalocated in thesrc/main/java/com/example/bookpubdirectory at the root of our project with the following content:
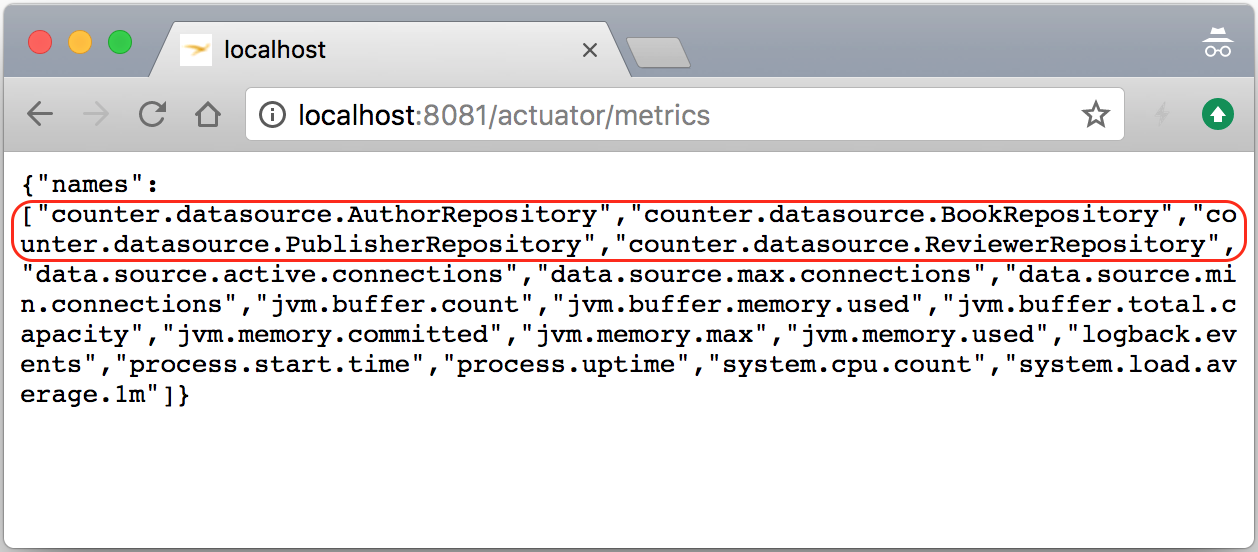
- So, let's start our application by executing
./gradlew clean bootRunand then we can access the/metricsendpoint by opening our browser and going tohttp://localhost:8081/actuator/metricsto see our newDbCountMetricsclass added to the existing metrics list, as follows:
- Our next step would be to get our application to appear in the Spring Boot Admin Web, which we created earlier. To make this happen, we will need to add a dependency on the
compile("de.codecentric:spring-boot-admin-starter-client:2.0.0-SNAPSHOT")library tobuild.gradlein the directory at the root of our project. - Additionally,
application.propertieslocated in thesrc/main/resourcesdirectory in the root of our project needs to be enhanced with the following entries:
- Once again, let's start our application by executing
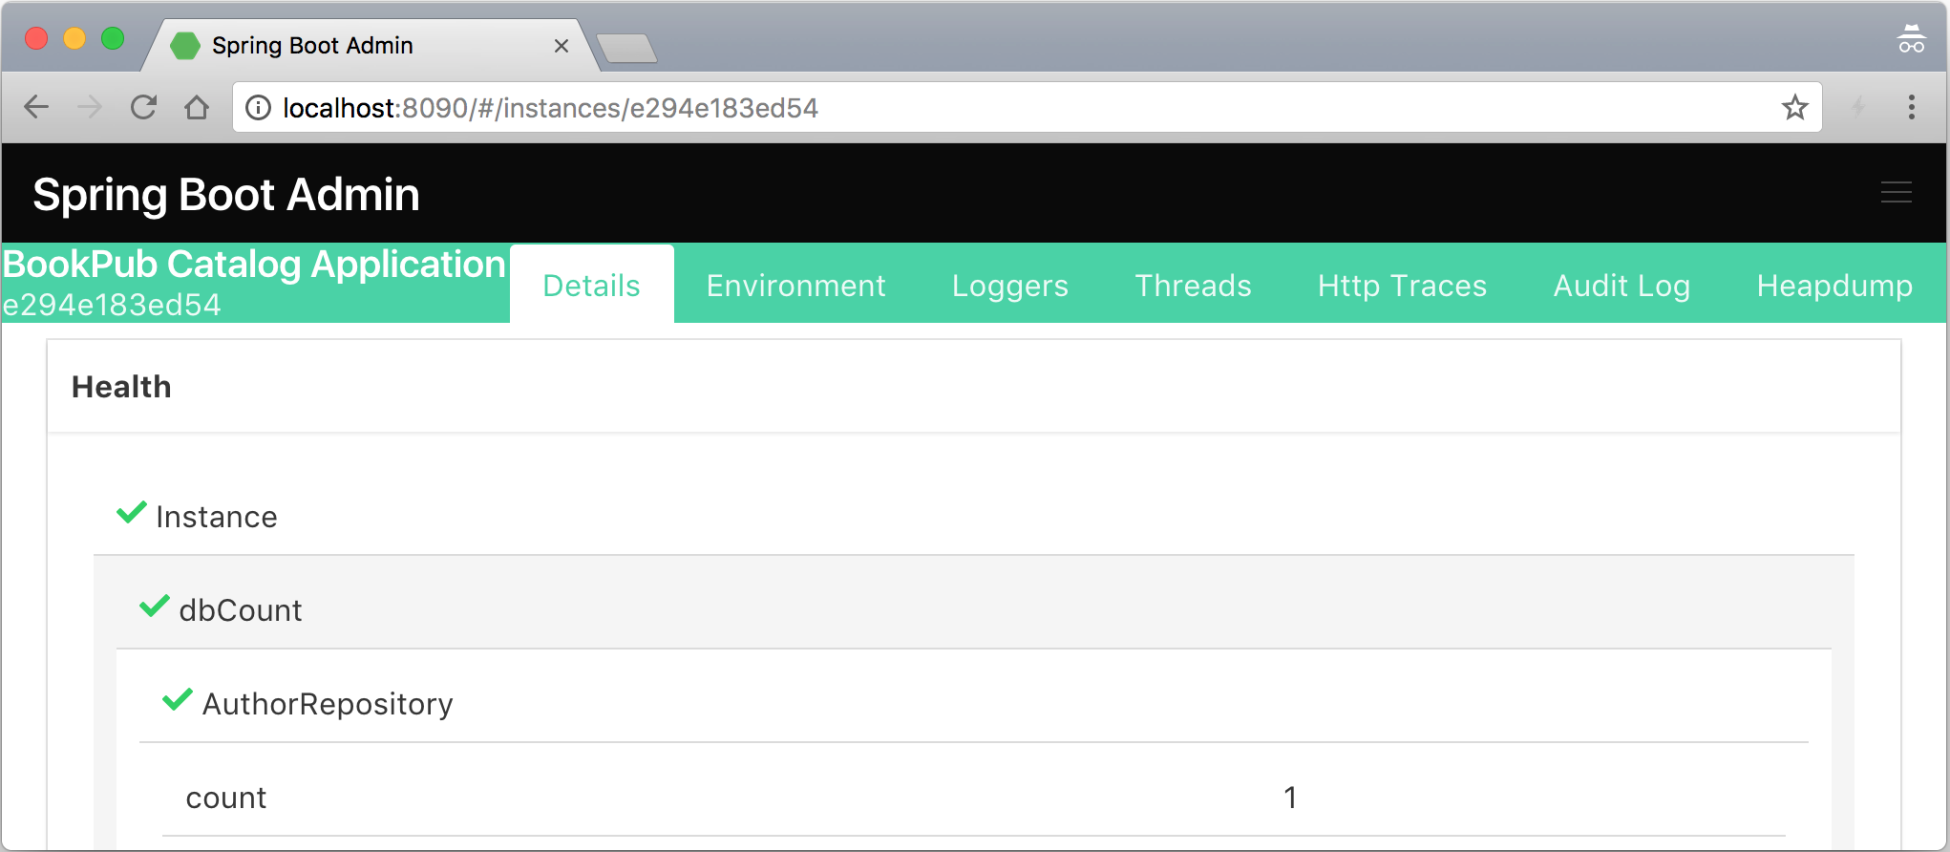
./gradlew clean bootRun, and if we now go to Spring Boot Admin Web by directing our browser tohttp://localhost:8090, we should see a new entry for our application namedBookPub Catalog Applicationappear in the list. If we click on theDetailsbutton on the right-hand side and scroll down to theHealthsection, we will see our custom health indicators along with the others reported in a form of nicer looking hierarchical entries in a table, as follows:
在我们深入研究创建和发出指标的细节之前,先说一下 Spring Boot Admin Web。它是一个简单的 Web GUI,在后端使用 Spring Boot Actuator 公开的相同端点,我们在上一个秘籍中了解了这些端点。当我们单击 Admin Web 中的各种链接时,数据会从应用程序中提取出来,并以漂亮的图形方式显示——没有魔法!
除了添加客户端库依赖项之外,我们只需要配置一些属性即可让我们的应用程序连接并注册到 Admin Web:
spring.application.name=BookPub Catalog Application: This configures the name of the application that we have chosen to use. It is also possible to take the value from the description property defined ingradle.propertiesusing the resource processing task in Gradle. Admin Web uses this value when displaying the application list.spring.boot.admin.client.url=http://localhost:8090: This configures the location of the Admin Web application so that our application knows where to go in order to register itself. As we are running on port8080, we chose to configure Admin Web to listen on port8090, but any port can be chosen as desired. You can see more configuration options by visiting https://codecentric.github.io/spring-boot-admin/current/.
如果我们还想通过 UI 启用日志记录级别控制,我们需要将 Jolokia JMX 库添加到我们的 compile("org.jolokia:jolokia-core:+")
构建依赖 以及根目录下src/main/resources目录下的logback.xml文件以下 内容的项目:
Spring Boot 中的指标工具非常强大且可扩展,提供了许多不同的方法来发出和使用指标。从 Spring Boot 2.0 开始,Micrometer.io 库在后台被用于提供非常全面的监控解决方案。开箱即用,Spring Boot 已经配置了许多监控系统资源的数据指标,例如堆内存、线程数、系统正常运行时间等,以及数据库使用情况和 HTTP 会话数。 MVC 端点还用于测量请求延迟(以毫秒为单位)以及每个端点请求状态的计数器。
通过 发出 各种指标,例如仪表、计数器、计时器等>MeterRegistry 由 Spring Boot 在运行时提供的实现。注册表可以很容易地自动装配到任何 Spring 管理的对象中,并用于发出指标。
例如,我们可以轻松计算特定方法被调用的次数。我们需要做的就是在创建期间将 MeterRegistry 的实例自动装配到我们的对象中,并将以下行放在方法的开头:
每次调用该方法时,特定的指标计数都会增加。
这种方法会给我们可以增加的计数,但是如果我们想测量延迟或任何其他任意值,我们将需要使用 Gauge 来提交我们的指标。要测量我们的方法执行需要多长时间,我们可以使用 MeterRegistry 并在方法的开头记录时间:
然后我们将放置我们的代码并在返回之前再次捕获时间:
然后,我们将发出度量标准 meterRegistry.gauge("objectName.methodName.latency", end - start);,它将更新最后一个。 gauge 用于计时目的是非常初级的,而 MeterRegistry 实际上提供了一种特殊类型的计量器——定时器。例如,Timer 计量器提供了包装可运行或可调用 lambda 并自动计时执行的能力。使用 Timer 而不是 Gauge 的另一个好处是 Timer 计量器可以同时保存事件计数以及执行每次事件的延迟。
MeterRegistry 实现涵盖了大多数简单的用例,当我们在自己的代码中操作并且可以灵活地将它们添加到我们需要的地方时非常方便。然而,情况并非总是如此,在这些情况下,我们需要通过创建 MeterBinder 的自定义实现来包装我们想要监控的任何内容。在我们的例子中,我们将使用它来公开数据库中每个存储库的计数,因为我们无法将任何监控代码插入到 CrudRepository 代理实现中。
每当 MeterRegistry 实现没有提供足够的灵活性时,例如,当需要将对象包装在像 Gauge,大多数仪表实施提供流体生成器以获得更大的灵活性。在我们的示例中,为了包装存储库指标,我们使用 Gauge 流体构建器来构造 Gauge:
metricName: This specifies the name to use to uniquely identify this metricrepository: This provides an object on which we invoke the method that should return a numeric value thatgaugewill reportCrudRepository::count: This is the method that should be called on therepositoryobject to get the current count of entries
这使我们能够构建灵活的包装器,因为我们所要做的就是提供一个对象,该对象将公开必要的数值和一个函数引用,该函数引用应该在实例上调用以在 量规评估。
MeterBinder接口,用于导出Meter,只定义了一个方法void bindTo(MeterRegistry);,实现者需要对正在监控的内容进行编码。实现类需要暴露为@Bean,在应用初始化时会被自动拾取处理。假设使用提供的 MeterRegistry 实现实际注册了创建的 Meter 实例,通常通过终止流体构建器的链调用 .builder(...).register(registry),度量将通过 MetricsEndpoint 公开,这将公开所有每次调用 /metrics 执行器时向注册表注册的计量器。
值得一提的是,我们在主应用程序上下文而非管理上下文中创建了 MeterBinder 和 HealthIndicator bean。原因是即使数据通过管理端点公开,端点 bean,如 MetricsEndpoint,在主应用程序上下文中定义,因此期望所有其他自动装配的依赖关系也将在那里定义。
这种方法是安全的,因为为了访问信息,需要通过 WebMvcEndpointHandlerMapping 实现外观,该外观在管理上下文中创建并使用来自主要应用程序上下文。查看MetricsEndpoint 类和对应的@Endpoint 注解以查看详细信息。
在当今时代,RESTful HTTP JSON 服务是一种事实上的访问数据的方式,但这并不是唯一的方式。另一种相当流行和常见的实时管理系统的方法是通过 JMX。好消息是 Spring Boot 已经提供了与通过 HTTP 一样通过 JMX 公开管理端点的相同级别的支持。实际上,这些是完全相同的端点。它们只是包裹在 MBean 容器周围。
在这个秘籍中,我们将看看如何通过 JMXretrieve 相同的信息a id="id326696658" class="indexterm"> 就像我们通过 HTTP 所做的那样,以及如何公开一些 MBean,这些 MBean 由第三方库通过 HTTP 使用 Jolokia JMX 库提供。
如果您还没有为上一个秘籍这样做,那么将 Jolokia JMX 库添加到我们的 compile("org.jolokia:jolokia-core:+") 构建依赖项和将 management.jolokia.enabled=true 属性添加到 application.properties,因为我们需要它们通过 HTTP 公开 MBean。
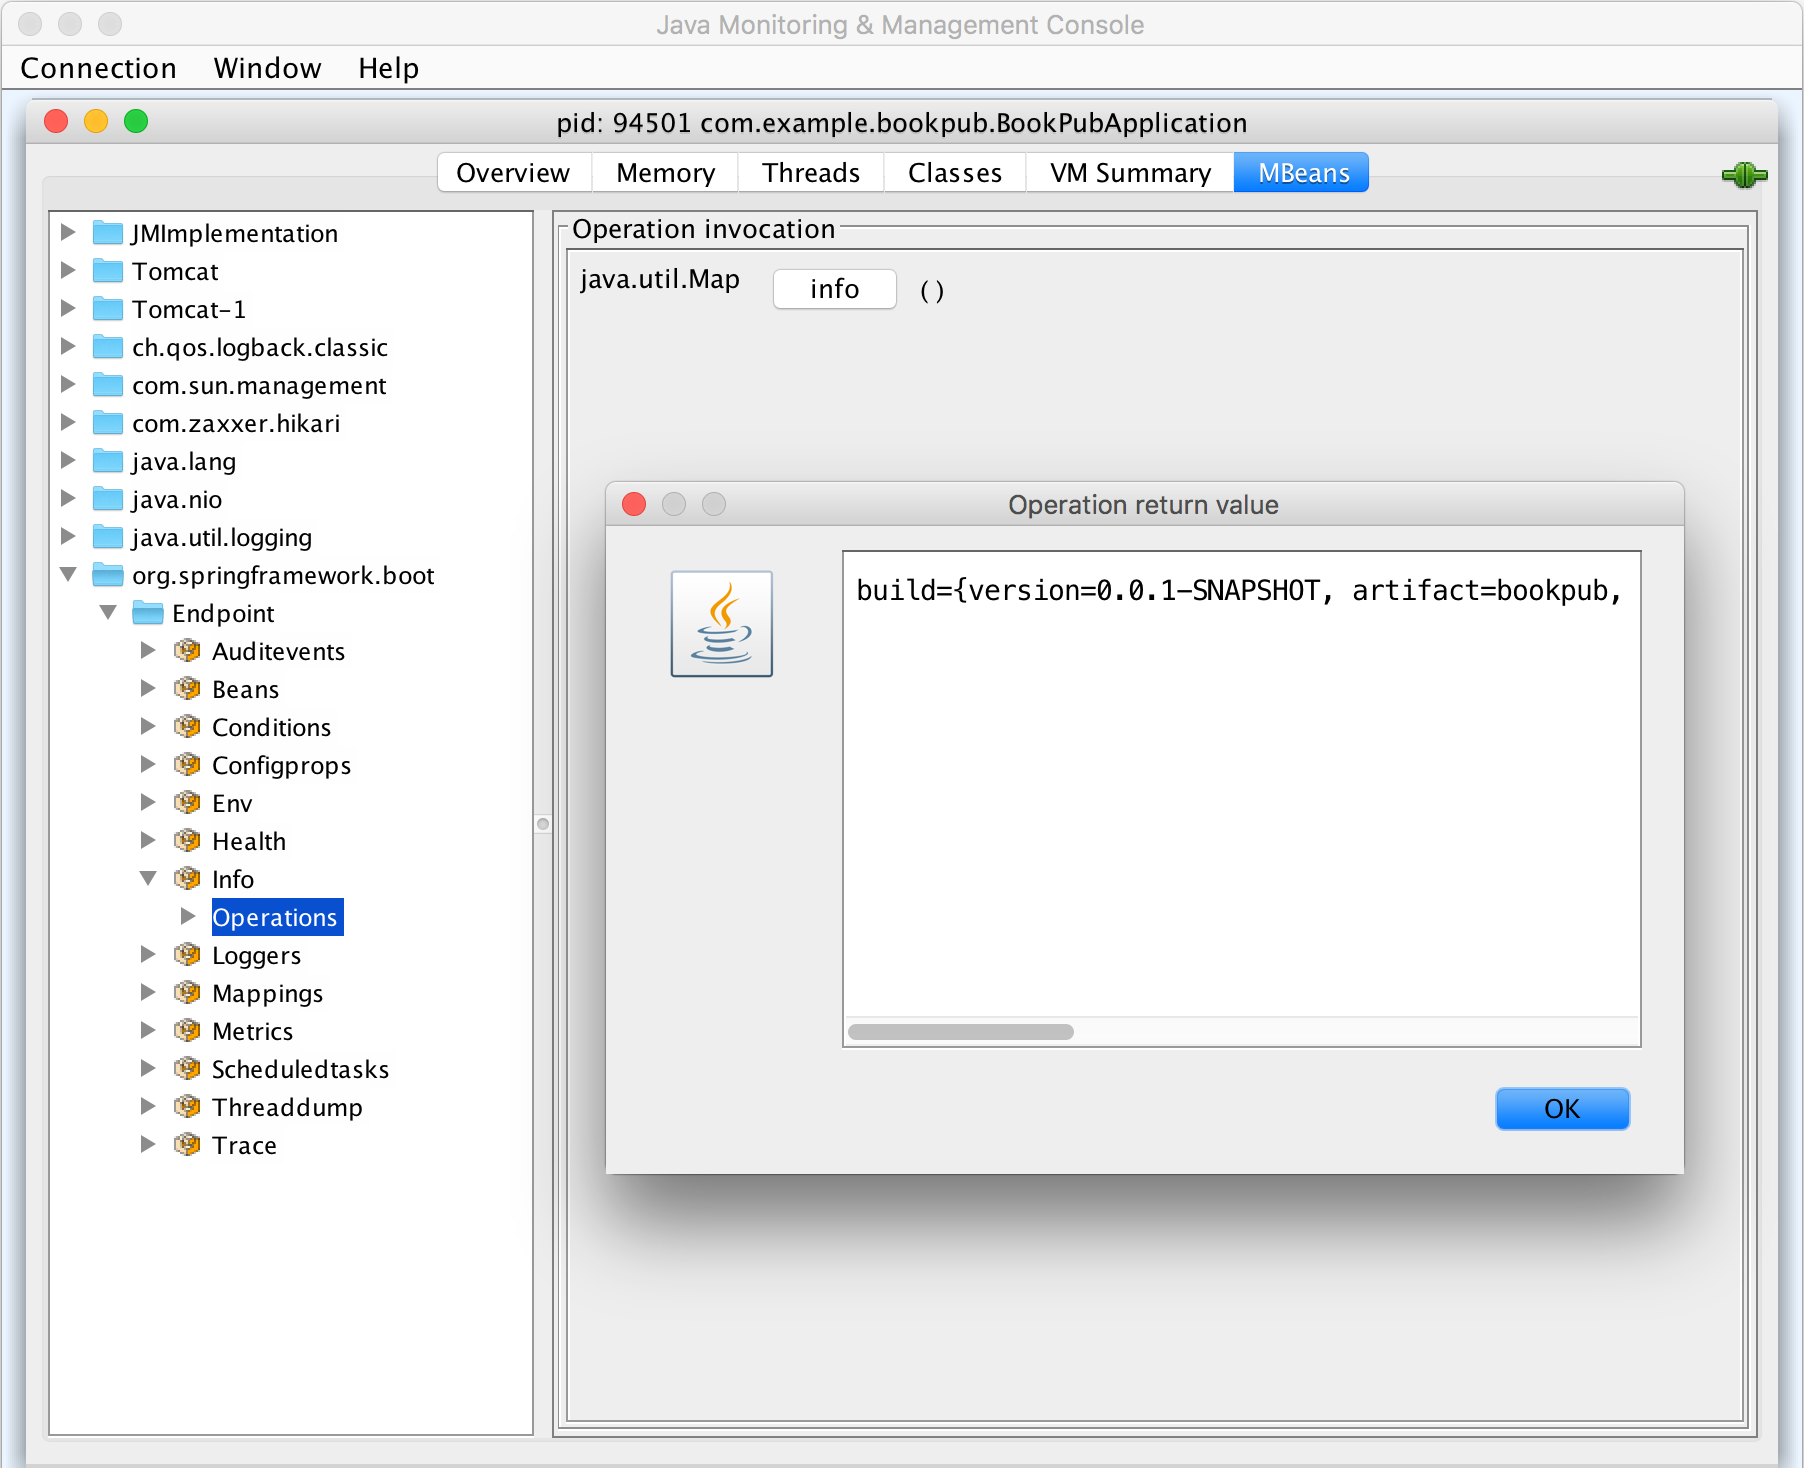
- After we add the Jolokia JMX dependency, all we need to do is build and start our application by executing
./gradlew clean bootRunand now we can simply launch jConsole to see the the various endpoints exposed under theorg.springframework.bootdomain:
- Having the Jolokia JMX library added to the classpath, Spring Boot also enables the accessing of all the registered MBeans via HTTP API using the
/jolokiaendpoint. To find out themaxThreadssetting for our Tomcat HTTP port8080connector, we can either look it up using jConsole by selecting themaxThreadsattribute on theTomcat:type=ThreadPool,name="http-nio-8080"MBean to get the value of200or we can use Jolokia JMX HTTP by opening our browser and going tohttp://localhost:8081/actuator/jolokia/read/Tomcat:type=ThreadPool,name=%22http-nio-8080%22/maxThreadsand we should see the following JSON response:
默认情况下,Spring Boot Actuator 在添加到应用程序时会启用所有端点和管理服务。这也包括 JMX 访问。如果出于某种原因,想通过 JMX 禁用特定端点的暴露,可以通过添加 management.endpoints.jmx.exclude=<id> 或者为了禁用所有 Spring MBean 的导出,我们可以在 application.properties 中配置 spring.jmx.enabled=false 设置
。
类路径中存在 Jolokia 库会触发 Spring Boot JolokiaManagementContextConfiguration,它将自动配置 ServletRegistrationBean 接受请求 < code class="literal">/jolokia 执行器路径。还可以通过 management.endpoint.jolokia.config.* 属性集设置各种特定于 Jolokia 的配置选项。完整列表可在 https:// jolokia.org/reference/html/agents.html#agent-war-init-params。如果您想使用 Jolokia,但想手动设置它,我们可以通过配置 management.endpoint.jolokia.enabled=false 告诉 Spring Boot 忽略它的存在application.properties 中的属性设置。
你们中的一些人可能回忆所有管理 是通过 SSH 直接在机器上完成的,它具有完全的灵活性和控制力,甚至可以使用 SSH 连接到管理端口并将所需的任何更改直接应用于正在运行的应用。尽管 Spring Boot 在 2.0 版本中移除了与 CRaSH Java Shell 的原生集成,但仍有一个开放的 source 项目, sshd-shell-spring-boot,它带回了这种能力。
对于这个秘籍,我们将使用我们在本章前面创建的健康指示器和管理端点。我们将通过 SSH 控制台访问公开相同的功能。
- The first step to getting SSHd Shell to work is to add the necessary dependency starters to our
build.gradlefile, as follows:
- We also need to explicitly enable it by setting the following property in
application.properties, located in thesrc/main/resourcesdirectory in the root of our project it needs to be enhanced with the following entries:
- Now, let's start our application by executing
./gradlew clean bootRunand then connect to it via SSH by executingssh -p 8022 admin@localhost. - We will be prompted for a password so let's find the autogenerated hash key in the application startup log, which would look as follows:
- If the password is entered correctly, we will be greeted by the following welcome prompt:
- Next, we will invoke our existing
/healthendpoint by typing health and we should get the following result:
- Typing
helpwill show the list of all the existing commands so you can play with some of them to see what they do and then we will proceed with adding our own SSHd Shell command, which will enable us to add new publishers to the system via the command line. - Make a new directory named commands in
src/main/java/com/example/bookpub/commandat the root of our project. - Add a file named
Publishers.javain thesrc/main/java/com/example/bookpub/commanddirectory at the root of our project with the following content:
- With the commands built up, now let's start our application by executing
./gradlew clean bootRunand then connect to it via SSH by executingssh -p 8022 admin@localhostand log in using the generated password hash. - When we type publishers, we will see the list of all the possible commands, as follows:
- Let's add a publisher by typing
publishers add Fictitious Booksand we should see the following message:
- If we will now type publishers list, we will get a list of all the books:
- Removing a publisher is a simple command
publishers remove 2that should respond with the"Removed publisher 2"message. - Just to confirm that the publisher is really gone, execute publishers list and we should see the following output:
SSHd Shell 与 Spring Boot 为您提供了许多开箱即用的命令。我们可以通过 HTTP 和 JMX 调用相同的管理端点。我们可以访问 JVM 信息,更改日志配置,甚至与 JMX 服务器和所有注册的 MBean 交互。所有可能性的列表确实令人印象深刻并且功能非常丰富,所以我绝对建议您阅读 SSHd 转到 https://github.com/anand1st/ sshd-shell-spring-boot。
在 Spring Boot 中,期望使用 @SshdShellCommand 注释的任何类将被自动拾取并注册为 SSHd Shell 命令。注释属性的值转换为主命令名称。在我们的例子中,我们将类注释属性值字段设置为 publishers,这成为 SSH Shell 控制台中的顶级命令名称。
如果命令包含子命令,如我们的发布者命令示例中,那么,也使用 @SshdShellCommand 注释的类的方法将注册为主命令的子命令命令。如果一个类只有一个方法,它将自动成为给定类的唯一命令,在键入命令名称时将执行该命令。如果我们希望多个子命令驻留在类命令中,就像我们对发布者所做的那样,每个转换为命令的方法都需要使用 @SshdShellCommand 进行注释。
目前,SSHd Shell 框架有一个限制,即只能将一个属性参数传递给命令,但正在开展工作以扩展该功能。同时,建议使用 JSON 有效负载与作为输入或输出的命令进行通信。
注释上提供了以下属性:
value: This attribute defines the command or sub-command name. Even though the name of the method does not need to match the name of the command, it is a good convention for keeping the two in sync to make the code more readable.description: This attribute defines the text that gets displayed when thehelpcommand is invoked. It is a good place to communicate with the users how the command is expected to be used, what inputs it takes, and so on. It is a good idea to provide as much description and documentation as possible as in the Shell, one would like to clearly educate the users of what needs to happen and how to call the command. The man pages are great so keep the documentation top notch.roles: This attribute enables us to define a security constraint on who is allowed to execute the given command. If Spring Security is also used, SSHd Shell provides the ability to configure a custom or specificAuthenticationProviderto be used for handling user authentication and role binding. For example, it would be easy to connect your application to the company's LDAP server and allow developers to use their regular credentials and also configure different role access controls, based on the needs of the particular organization.
可以使用帮助来查询每个命令的用法,或者在包含子命令的命令的情况下,通过键入顶级命令的名称来查询。
虽然 SSHd Shell 带有许多内置命令,但可以轻松添加自定义命令,利用标准 Spring / Spring Boot 编程风格,使用 @Autowired 和 @Component 注释来获取必要的依赖关系,以便在应用程序启动生命周期中连接并自动配置。
SSHd Shell 还提供了一个很好的功能,可以使用后处理器,由管道 (|) 符号调用。当前支持允许输出突出显示 | h packt,它将突出显示输出中的单词 packt,或通过电子邮件发送响应输出 | m[email protected],如果 Spring Mail 也已配置并可用。
如果我们可以将 不同的 命令链接在一起,就像在 Linux 中一样,以帮助处理输出和过滤,那就太好了当信息量趋于压倒性时,就可以提取必要的数据。想象一下,我们的发布者列表命令返回的不是 2,而是 2000 个发布者。从这个列表中,我们想要找到以 Pa 开头的那些。
即使 SSHd Shell 不provide 这种开箱即用的功能,它通过定义扩展 BaseUserInputProcessor 类的bean 为我们提供了实现我们自己的后处理器的能力。让我们创建一个支持过滤 JSON 响应的工具,类似于 jq 命令行实用程序的工作方式。
为此,让我们在 src/main/java/com/example/bookpub/commandJsonPathUserInputProcessor.java 的类> 项目根目录下,内容如下:
使用管道功能,我们可以通过以下方式轻松地将 publishers list 命令与 jq 命令链接起来:
在我们的示例中,这应该只返回一条记录,如下所示:
虽然它不是一个成熟的管道功能,但输入处理器的使用允许添加诸如排序、过滤和显示渲染之类的功能,从而为模块化和重用常见行为提供了更大的灵活性。
SSHd Shell Spring Boot 集成带有许多配置选项,允许我们禁用组件、配置身份验证设置以及指定用户名、密码甚至密钥证书。例如,如果我们想使用特定的用户名和密码,我们可以通过配置以下属性来实现:
在现实世界的 enterprise 环境中,使用 shared 键用于限制访问,可以使用 sshd.shell.publicKeyFile=<key path> 或 < code class="literal">sshd.shell.hostKeyFile=
AuthenticationProvider 实现与 Spring Security 一起允许将身份验证机制集成到公司的身份验证系统中。
在本章前面,您了解了 Spring Boot 提供的 监控 功能。我们看到了编写自定义 HealthIndicators、创建指标以及使用 MeterRegistry 发出数据的示例。简单的 Spring Boot Admin Web 框架为我们提供了一些漂亮的图形 UI 来可视化数据,但所有这些指标都是即时的,没有长期保留和历史访问。无法观察趋势、检测与基线的偏差以及将今天与上周进行比较并不是一个很好的策略,尤其是对于企业复杂的系统而言。我们都希望能够访问数周(如果不是数月)的时间序列数据,并在出现意外情况时设置警报和阈值。
这个秘籍将向我们介绍一个惊人的时间序列图形工具:Graphite。 Graphite 是一个由两部分组成的系统。它为数字时间序列数据提供存储,以及以按需图形的形式呈现此数据或将图形数据公开为 JSON 流的服务。您将学习如何将 Spring 的 Micrometer 监控框架与 Graphite 集成和配置,以便将监控数据从 Spring Boot 应用程序发送到 Graphite,并使用 Graphite 来可视化我们收集的不同统计信息。
Graphite 是一个用 Python 编写的应用程序,因此能够在几乎任何支持 Python 及其库的系统上运行。在任何给定系统上安装 Graphite 有多种方法,从源代码编译、一直使用 pip 到为各种 Linux 发行版预构建 RPM。
对于所有不同的安装策略,请查看 Graphite 文档 http://graphite.readthedocs.org/en/latest/install.html。 OS X 用户可以阅读位于 https:// 的非常好的分步指南gist.github.com/relaxdiego/7539911。
出于本秘籍的目的,我们将使用一个包含 Graphite 及其对应物 Grafana 的预制 Docker 容器。虽然有大量包含 Graphite 和 Grafana 组合的 Docker 映像的各种预构建变体,但我们将使用来自 https://registry.hub.docker.com/u/alexmercer/graphite-grafana/ 因为它包含所有正确的配置,这对我们来说很容易快速开始:
- The first step will be to download the desired Docker container image. We will do this by executing
docker pull alexmercer/graphite-grafana. The container size is about 500 MB; so the download might take a few minutes depending on your connection speed. - Both Graphite and Grafana store their data in the database files. We will need to create external directories, which will reside outside the container, and we will connect them to a running instance via Docker data volumes.
- Make a directory for the Graphite data anywhere in your system, for example, in
<user_home>/data/graphite. - Make a directory for the Grafana data, for example, in
<user_home>/data/grafana.
- Make a directory for the Graphite data anywhere in your system, for example, in
- In this container, the Graphite data will go to
/var/lib/graphite/storage/whisper, while Grafana stores its data in/usr/share/grafana/data. So, we will use these paths as internal volume mount destinations when starting the container.
- Run the container by executing
docker run -v <user_home>/data/graphite:/var/lib/graphite/storage/whisper -v <user_home>/data/grafana:/usr/share/grafana/data -p 2003:2003 -p 3000:3000 -p 8888:80 -d alexmercer/graphite-grafana.- In Docker, the
-voption configures a volume mount binding. In our example, we configured the external<user_home>/data/graphitedirectory to be the same as the/var/lib/graphite/storage/whisperdirectory reference in the container. The same goes for the<user_home>/data/grafanamapping. We can even look in the<user_home>/data/graphite or data/grafanadirectories to see them contain the subdirectories and files. - The
-poption configures the port mappings similar to the directory volumes. In our example, we mapped the following three different ports to be accessible from outside the container to the internal ports to which the various services are bound:2003:2003: This port mapping externalizes the Graphite data stream listener known as Carbon-Cache Line Receiver, to which we will connect in order to send the metrics data.3000:3000: This port mapping externalizes the Grafana Web Dashboard UI, which we will use to create visual dashboards on top of the Graphite data.8888:80: This port mapping externalizes the Graphite Web UI. Though it is running on port80in the container, it is unlikely that on our development machine, port80is open; so it is better to map it to some other higher number port such as8080or8888in our case, as8080is already taken by ourBookPubapplication.
- In Docker, the
- If everything has gone according to the plan, Graphite and Grafana should be up and running and thus, we can access Graphite by pointing our browser to
http://localhost:8888and we should see the following output:

- The default login and password for Grafana are
admin/adminand can be changed via the Web UI Admin.
随着 Graphite 和 Grafana 的启动和运行,我们现在可以开始配置我们的应用程序,以便将指标发送到 Graphite端口 2003 上的侦听器。为此,我们将使用 Spring Boot 完全支持的 Codahale/Dropwizard 指标库,因此需要最少的配置:
- The first thing on our list is to add the necessary library dependencies. Extend the dependencies block in the
build.gradlefile with the following content:
- Create a file named
MonitoringConfiguration.javain thesrc/main/java/com/example/bookpubdirectory at the root of our project with the following content:
- Now, let's build and run our application by executing
./gradlew clean bootRunand if we have configured everything correctly, it should start without any issues. - With the application up and running, we should start seeing some data that is in the Graphite and
bookpubdata nodes getting added to the tree under metrics. To add some more realism, let's open our browser and load a book URL,http://localhost:8080/books/978-1-78528-415-1/, a few dozen times to generate some metrics. - Let's go ahead and look at some of the metrics in Graphite and set the data time range to 15 minutes in order to get some close-look graphs, which will look similar to the following screenshot:
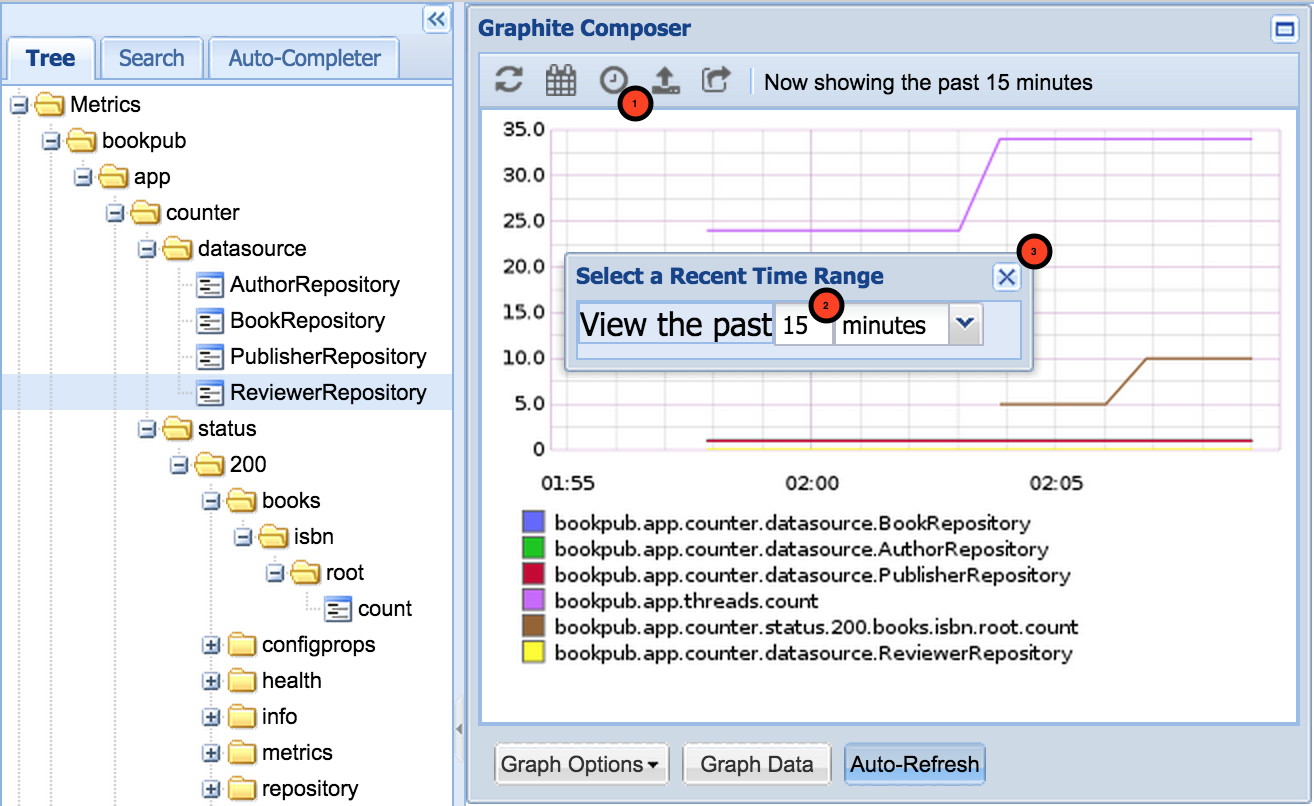
- The newly created
Graphpanel will look like this:
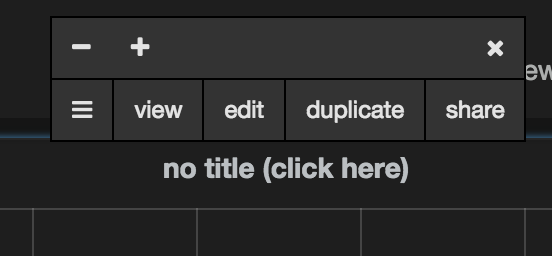
- Click on the
no title (click here)label, chooseedit, and enter the metric namebookpub.app.http.server.requests.exception.None.method.GET.status.200.uri._books__isbn_.countin the text field as shown in the following screenshot:

- Clicking on
Dashboardwill take you out of the edit mode.
如需更详细的教程,请访问 http://docs.grafana.org/guides /gettingstarted/。
为了能够通过 Graphite 导出指标,我们添加了对 io.micrometer:micrometer-registry-graphite 库的额外依赖。然而,在底层,它依赖于 Dropwizard 指标库来提供 Graphite 集成,因此它将以下新依赖项添加到我们的 build 文件中:
io.dropwizard.metrics:metrics-core: This dependency adds the basic Dropwizard functionality,MetricsRegistry, common API interfaces, and base classes. This is the bare minimum that is required to get Dropwizard working and integrated into Spring Boot to handle the metrics.io.dropwizard.metrics:metrics-graphite: This adds support forGraphiteReporterand is needed in order to configure Dropwizard to send the monitoring data that it collects to our Graphite instance.
为了保持干净和良好的分离,我们创建了一个单独的配置类,其中包含所有与监控相关的 bean 和设置:MonitoringConfiguration。在这个类中,我们配置了三个@Bean实例:一个自定义的MeterRegistryCustomizer 实现自定义GraphiteMeterRegistry 实例、HigherarchicalNameMapper 和 NamingConvention 与之配套。
我们必须创建自己的定制的原因是双重的。我们希望遵守经典的 Graphite 指标命名方案,该方案使用点 (.) 符号来分隔层次结构中的指标名称。不幸的是,无论出于何种原因,Micrometer Graphite 实现选择使用 camelCase 折叠表示法,这使得度量名称像 counter.datasource.BookRepository< /code> 转换为 counterDatasourceBookRepository 名称以显示在 Graphite 中。当存在许多指标时,具有如此长的名称,没有分层树使得在 Graphite UI 中搜索和发现非常困难。此外,所有指标都放置在根 (/) 树下,没有创建专用的应用程序文件夹,这也导致可读性和使用率低下。我们已将代码添加到我们的 HigherarchicalNameMapper 实例中,以将应用程序前缀添加到导出到 Graphite 的所有指标中,以便它们都放入 子树中: /bookpub/app/*.:
NamingConvention 提供了有关如何将特定 Meter 名称、键、值和标签转换为适当 Graphite 变体的精确配置。在 format(String name) 方法中,我们声明我们要使用点 (.) 分隔元素 NamingConvention.dot 实现。
properties 的 management.metrics.export.graphite 组定义了如何将数据发送到 Graphite 实例。我们将其配置为每 1 分钟执行一次,将所有持续时间间隔(例如延迟测量)转换为毫秒,并将所有可变速率(例如每个时间帧的请求数)转换为秒。这些值中的大多数都提供了 Graphite 的默认配置设置,但可以根据需要进行更改。
请注意,我们使用了 @ConditionalOnClass 注释来表明我们只想应用这个 @Configuration 如果 Micrometer Graphite提供的类 GraphiteMeterRegistry.class 存在于类路径中。这需要在测试期间不要尝试实例化 Graphite bean,因为在测试环境中可能没有运行和可用的 Graphite 实例。
从 Graphite UI 的可用指标中可以看出,有许多开箱即用的指标。一些值得注意的是关于 JVM 和 OS 指标,它们将内存和线程指标暴露给内存和线程数据节点中的 Graphite 以及其他数据。它们可以在 Metrics/bookpub/app/jvm、Metrics/bookpub/app/process 或 中找到class="literal">Metrics/bookpub/app/system 在 Graphite 树中。
Micrometer 核心库为其他系统指标提供了许多仪表绑定器。如果需要导出诸如线程或执行器信息之类的东西,或者查看文件描述符,可以通过简单地声明一个返回 new JvmThreadMetrics() 的方法来导出其他 bean 或 new FileDescriptorMetrics() 例如。
正在运行的应用程序将收集所有使用 MeterRegistry 注册的指标,并且每个配置的导出器(在我们的例子中, GraphiteMeterRegistry)报告所有这些指标按时间间隔到达目的地。正确的导出器实现在单独的 ThreadPool 中运行,因此在主应用程序线程之外并且不会干扰它们。但是,应该记住这一点,以防 Meter 实现在内部使用一些 ThreadLocal 数据,这些数据对导出器不可用。
前面的秘籍让我们了解了如何在 应用程序 在其运行时收集各种指标。我们还看到了将这些数据可视化为一组历史趋势图的能力是多么强大。
虽然 Grafana 和 Graphite 为我们提供了非常强大的功能,可以以图形的形式处理数据并构建充满阈值、应用数据功能等的精致仪表板,但有时我们想要更简单、更易读和更小部件的东西。这正是 Dashing 提供的仪表板体验。
Dashing是一个流行的dashboard框架开发由 Shopify 用 Ruby/Sinatra 编写。它使您能够创建由不同类型的小部件组成的各种仪表板。我们可以使用图形、仪表、列表、数值或纯文本等内容来显示信息。
在这个秘籍中,我们将安装 Dashing 框架,学习如何创建仪表板,发送和使用数据以直接从应用程序报告以及从 Graphite 中获取数据,并使用 Dashing API 将数据推送到 Dashing 实例。
为了让 Dashing 运行,我们需要一个安装了 RubyGems 的 Ruby 1.9+ 的环境。
通常,Ruby 应该可以在任何常见的 Linux 和 OS X 发行版上使用。如果您运行的是 Windows,我建议使用 http://rubyinstaller.org 以获取安装包。
一旦您有了这样的环境,我们将安装 Dashing 并创建一个新的仪表板应用程序供我们使用,如下所示:
- Installing Dashing is very easy; simply execute the gem install dashing command to install Dashing RubyGems on your system.
- With the RubyGem successfully installed, we will create the new dashboard named
bookpub_dashboardby executing the dashing newbookpub_dashboardcommand in the directory where you want the dashboard application to be created. - Once the dashboard application has been generated, go to the
bookpub_dashboarddirectory and execute thebundlecommand to install the required dependency gems.
- After the gems bundle has been installed, we can start the dashboard application by executing the
dashing startcommand and then pointing our browser tohttp://localhost:3030to see the following result:
如果您仔细查看我们闪亮的新仪表板的 URL,您会发现它实际上是 http://localhost:3030/sample 并显示了一个自动生成的示例仪表板.我们将使用此示例仪表板进行一些更改,以便直接显示来自我们应用程序的一些指标,并从 Graphite 数据 API 端点获取一些原始指标。
为了演示如何连接来自应用程序 /actuator/metrics 端点的数据以便将其显示在 Dashing 仪表板中,我们将更改 Buzzwords 小部件来显示我们的数据存储库的计数,如下所示:
- Before we start, we will need to add the
'httparty', '>= 0.13.3'gem to theGemfilefile located in thebookpub_dashboarddirectory, which will enable us to use an HTTP client in order to extract the monitoring metrics from the HTTP endpoints.
- After adding the gem, run the
bundlecommand one more time to install the newly added gem. - Next, we will need to modify the
sample.erbdashboard definition located in thebookpub_dashboard/dashboardsdirectory, replacing<div data-id="buzzwords" data-view="List" data-unordered="true" data-title="Buzzwords" data-moreinfo="# of times said around the office"></div>with<div data-id="repositories" data-view="List" data-unordered="true" data-title="Repositories Count" data-moreinfo="# of entries in data repositories"></div>. - With the widget replaced, we will create a new data provisioning job file named
repo_counters.rbin thebookpub_dashboard/jobsdirectory with the following content:
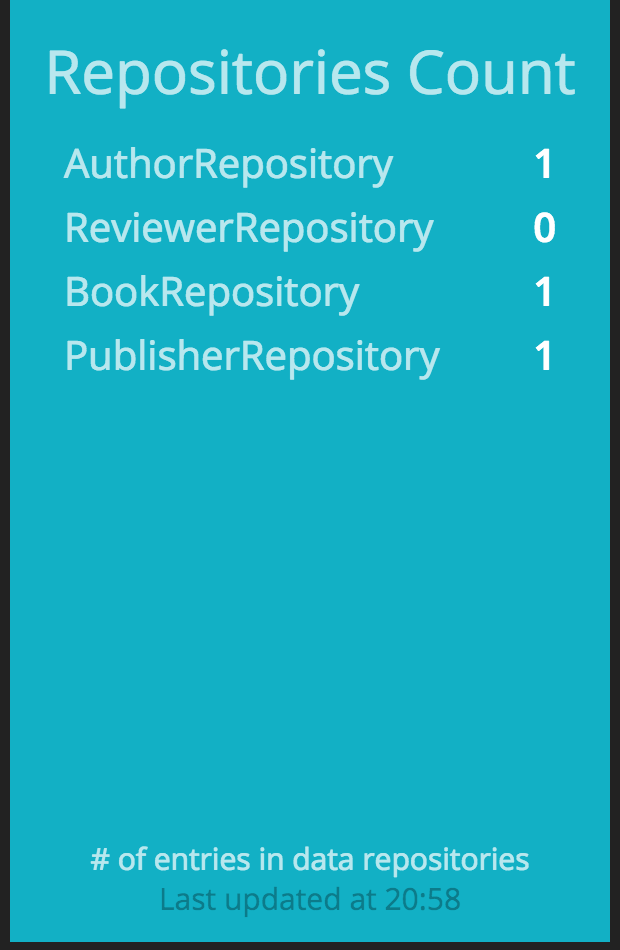
- If we use the remote Shell to log in to the application, as we did earlier in this chapter, and add a publisher, we would see the counter on the dashboard increase.
- Another way to push the data to the dashboard is to use their RESTful API. Let's update the text in the top left text widget by executing
curl -d '{ "auth_token": "YOUR_AUTH_TOKEN", "text": "My RESTful dashboard update!" }' http://localhost:3030/widgets/welcome.
- If everything has worked correctly, we should see the text updated to our new value,
My RESTful dashboard update!, under theHellotitle.
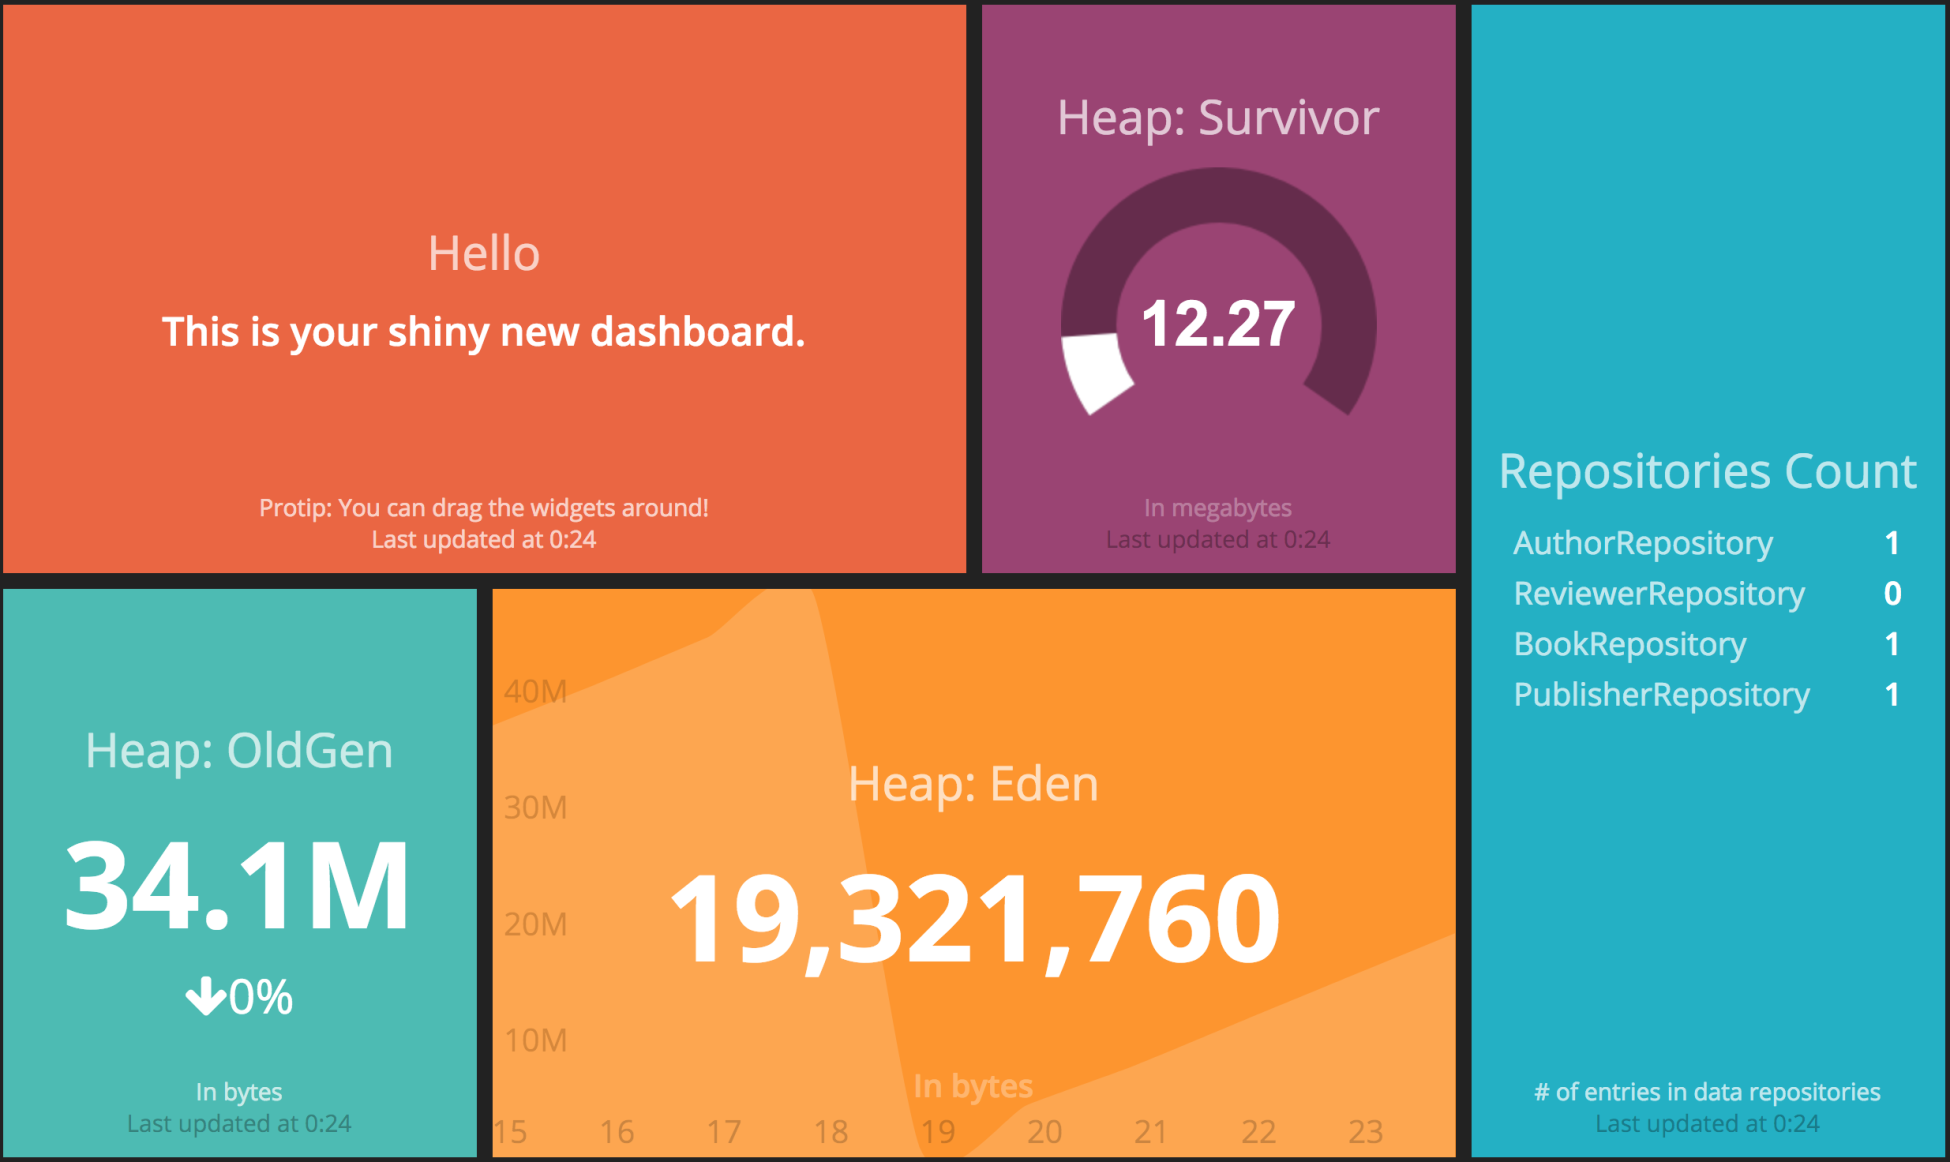
- In an environment where multiple instances of the same application kind are running, it is probably not a good idea to directly pull the data from each node, especially if they are very dynamic and can come and go as they please. It is advised that you consume the data from a more static and well-known location, such as a Graphite instance. To get a demonstration of volatile data metrics, we will consume the memory pool data for the
Eden,Survivor, andOldGenspaces and display them instead of theConvergence,Synergy, andValuationgraph dashboards. We will start by replacing the content of thesample.rbjob file located in thebookpub_dashboard/jobsdirectory with the following content:
- In the
sample.erbtemplate located in thebookpub_dashboard/dashboardsdirectory, we will replace theSynergy,Valuation, andConvergencegraphs with the following alternatives:
<div data-id="synergy" data-view="Meter" data-title="Synergy" data-min="0" data-max="100"></div>gets replaced with<div data-id="heap_survivor" data-view="Meter" data-title="Heap: Survivor" data-min="0" data-max="100" data-moreinfo="In megabytes"></div><div data-id="valuation" data-view="Number" data-title="Current Valuation" data-moreinfo="In billions" data-prefix="$"></div>gets replaced with<div data-id="heap_oldgen" data-view="Number" data-title="Heap: OldGen" data-moreinfo="In bytes" ></div><div data-id="convergence" data-view="Graph" data-title="Convergence" style="background-color:#ff9618"></div>gets replaced with<div data-id="heap_eden" data-view="Graph" data-title="Heap: Eden" style="background-color:#ff9618" data-moreinfo="In bytes"></div>
在这个秘籍中,我们看到了如何直接从我们的应用程序和通过 Graphite 提取数据,并使用 Dashing 仪表板进行渲染,以及使用他们的 RESTful API 将信息直接推送到 Dashing。看一次比听七次更好,这已经不是什么秘密了。在尝试全面了解代表系统在运行时的行为方式以及能够快速对数据采取行动的关键指标时,情况确实如此。
在不详细介绍 Dashing 的内部结构的情况下,重要的是要提及一些关于数据如何进入 Dashing 的事情。这可以通过以下两种方式发生:
- Scheduled jobs: This is used to pull data from the external sources
- RESTful API: This is used to push data to Dashing from outside
计划的作业在生成的仪表板应用程序的作业目录中定义。每个文件都有一段包裹在 SCHEDULER.every 块中的 ruby 代码,它计算数据点并将事件发送到带有新数据的适当小部件以进行更新。
在我们的配方中,我们创建了一个名为 repo_counters.rb 的新作业,我们使用 httparty 库进行直接调用到我们应用程序实例的 /actuator/metrics/#{name} 端点并提取每个预定义存储库的计数器。遍历指标,我们创建了一个 repo_counts 集合,其中包含每个存储库的数据,其中包含标签显示和值计数。生成的集合以 event: send_event('repositories', { items: repo_counts }) 的形式发送到存储库小部件以进行更新。
我们将此作业配置为每 10 秒执行一次,但是如果数据更改的速度不是很频繁,则可以将其更改为几分钟甚至几小时。每次调度程序运行我们的工作时,存储库小部件都会通过客户端 websockets 与新数据的通信进行更新。查看dashboards/sample.erb,我们可以使用data-id="repositories"找到小部件的定义。
除了添加我们自己的新作业外,我们还更改了现有的 sample.rb 作业以使用 Graphite 的 RESTful API 从 Graphite 中提取数据来填充不同类型的小部件以显示内存堆数据。由于我们没有直接从应用程序实例中提取数据,因此最好不要将代码放在同一个作业中,因为这些作业可能(在我们的例子中确实如此)具有不同的时间间隔。由于我们每分钟只向 Graphite 发送一次数据,因此将其拉取的频率低于此是没有意义的。
为了从 Graphite 中获取数据,我们使用了以下 API 调用:
看一下前面代码片段中提到的以下参数:
target: This parameter is a repeated value that defines a list of all the different metrics that we want to retrieve.from: This parameter specifies the time range; in our case, we asked for data going back 11 minutes to.format: This parameter configures the desired output format. We chose JSON but many others are available. Refer to http://graphite.readthedocs.org/en/latest/render_api.html#format.maxDataPoints: This parameter indicates how many entries we want to get.
我们要求 11 个条目而不是 10 个条目的原因是由于经常发生短距离请求的最后一个条目(仅包含几分钟)有时会返回为空。我们只使用前 10 个条目并忽略最近的条目以避免奇怪的数据可视化。
遍历目标数据,我们将填充适当的小部件,例如 heap_eden、heap_survivor和heap_oldgen,用他们指定的数据,如下:
heap_eden: This is aGraphwidget, as defined in thesample.erbtemplate in the form of adata-view="Graph"attribute, so it wants a data input in the form of the points collection containing a value forxandy. Thexvalue represents a timestamp, which conveniently gets returned to us by Graphite and is automatically converted to the minutes display value by the Graph widget. Theyvalue represents the memory pool utilization in bytes. As the value from Graphite is in the form of a decimal number, we will need to convert it to a whole number so as to make it look better.heap_survivor: This is aMeterwidget, as defined in thesample.erbtemplate in the form of adata-view="Meter"attribute, so it wants a data input as a simple value number between a template configured range. In our case, the range is set as thedata-min="0" data-max="100"attribute. Even though we chose to round the number to two decimal positions, it could probably just be an integer as it is precise enough for the purpose of a dashboard display. You will also notice that insidesample.rb, we convert the raw value, which is in bytes, into megabytes, for better readability—current_survivor = current_survivor / 1048576.heap_oldgen: This is aNumberwidget, as defined in thesample.erbtemplate in the form of adata-view="Number"attribute, so it wants a data input as a current value and optionally a last value; in this case, a percentage change with the change direction will be displayed as well. As we get the last 10 entries, we have no issues in retrieving both the current and last values so we can easily satisfy this requirement.
在这个秘籍中,我们还通过尝试使用 curl 命令更新欢迎小部件的值来尝试使用 Dashing 的 RESTful API。这是一个推送操作,可以在没有暴露数据 API 的情况下使用,但是您可以创建某种脚本或代码片段来将数据发送到 Dashing。为此,我们使用了以下命令: curl -d '{ "auth_token": "YOUR_AUTH_TOKEN", "text": "My RESTful dashboard update!" }' http://localhost:3030/widgets/welcome。
Dashing API 接受 JSON 格式的数据,通过 POST 请求发送,其中包含小部件所需的以下参数以及小部件 ID,它是 URL 路径本身的一部分:
auth_token: This allows for a secure data update and can be configured in the dashboard root directory in theconfig.rufile.text: This is awidgetproperty that is being changed. As we are updating aTextwidget, as defined in thesample.erbtemplate in the form of adata-view="Text"attribute, we need to send it to text to update./widgets/<widget id>: This URL path identifies the particular widget where the update is destined to. Theidcorresponds to a declaration in thesample.erbtemplate. In our case, it looks likedata-id="welcome".
各种小部件的定义也可以被操纵,社区已经创建了一个非常丰富的各种小部件集合,可在 https://github.com/Shopify/dashing/wiki/Additional-Widgets。小部件安装在 dashboard 的小部件目录中,只需运行 即可安装dashing install <GIST>,其中 GIST 是 GitHub Gist 条目的哈希值。
仪表板模板文件,类似于我们的 sample.erb 模板,可以修改以便为每个特定仪表板以及多个 dashboard 模板,可旋转或直接手动加载。
每个仪表板代表一个网格,其中放置了各种小部件。每个小部件由具有适当配置属性的 <div> 条目定义,并且应该嵌套在 <li> 网格元素。我们可以使用数据元素的属性来控制每个小部件在网格中的位置,如下:
data-row: This represents the row number where the widget should be positioneddata-col: This represents the column number where the widget should be positioneddata-sizex: This defines the number of columns the widget will span horizontallydata-sizey: This defines the number of rows the widget will span vertically
可以修改现有小部件以更改其外观和扩展其功能;所以天空是我们可以拥有什么样的信息显示的极限。您绝对应该查看 http://dashing.io 了解更多详情。