读书笔记《supercharge-your-applications-with-graalvm》第 2 章 JIT HotSpot 和 GraalJIT
Chapter 2: JIT, HotSpot, and GraalJIT
在上一章中,我们了解了 C1 和 C2 编译器以及 C2 编译器在运行时执行的代码优化和反优化。
在本章中,我们将深入探讨 C2 即时编译,并介绍 Graal 的即时编译。 Just-In-Time (JIT) 编译是使 Java 能够与传统 ahead-of-time (AOT) 编译器。正如我们在上一章中了解到的,JIT 编译随着 JVM 中的 C2 编译器而发展。 C2 JIT 编译器不断分析代码执行情况,并在运行时应用各种优化和反优化来编译/重新编译代码。
本章将是一个实践环节,我们将在其中获取示例代码并分析 C2 JIT 编译器的工作原理并介绍 Graal JIT。
在本章中,我们将介绍以下主题:
- Understand how the JIT compiler works
- Learn how code is optimized by JIT by identifying HotSpots
- Use profiling tools to demonstrate how the JIT compiler works
- Understand how GraalVM JIT works on top of JVM JIT
在本章结束时,您将清楚地了解 JIT 编译器的内部工作原理以及 GraalVM 如何进一步扩展它。我们将使用示例 Java 代码和分析工具(例如 JITWatch)来更深入地了解 JIT 的工作原理。
Technical requirements
要遵循本章中给出的说明,您将需要以下内容:
- All the source code referred to in this chapter can be downloaded from https://github.com/PacktPublishing/Supercharge-Your-Applications-with-GraalVM/tree/main/Chapter02.
- Git (https://github.com/git-guides/install-git)
- Maven (https://maven.apache.org/install.html)
- OpenSDK (https://openjdk.java.net/) and JavaFX (https://openjfx.io/)
- JITWatch (https://www.jrebel.com/blog/understanding-java-jit-with-jitwatch#:~:text=JITWatch%20is%20a%20log%20analyser,to%20the%20Adopt%20OpenJDK%20initiative)
- The Code in Action video for this chapter can be found at https://bit.ly/3w7uWlu.
Setup environment
在本节中,我们将设置本章其余部分所需的所有必备工具和环境。
Installing OpenJDK Java
您可以从 https://openjdk.java.net/install/ 安装 OpenJDK。此 URL 包含有关如何安装 OpenJDK 的详细说明。我们还需要 JavaFX。有关如何安装 JavaFX 的详细信息,请参阅 https://openjfx.io/。
Installing JITWatch
JITWatch 是最广泛使用的日志分析和可视化工具之一,用于了解 JIT 编译器的行为。这也广泛用于分析代码和确定更好的性能调整机会。
JITWatch 是一个活跃的开源项目,托管在 https://github.com/AdoptOpenJDK/jitwatch。
安装 JITWatch 的典型命令如下:
Taking a deep dive into HotSpot and the C2 JIT compiler
在上一章中,我们 介绍了 JVM 的演变以及 C2 JIT 编译器的演变过程。在本节中,我们将深入研究 JVM C2 JIT 编译器。使用示例代码,我们将了解 JIT 编译器在运行时执行的优化。要欣赏 Graal JIT 编译器,了解 C2 JIT 编译器的工作原理非常重要。
Profile-guided optimization 是 JIT 编译器的关键原则。虽然 AOT 编译器可以优化静态代码,但大多数时候,这还不够好。了解应用程序的运行时特性以识别优化机会非常重要。 JVM 有一个内置的分析器,可以动态地检测应用程序以分析一些关键参数并识别优化机会。一旦确定,它将将该代码编译为本地语言,并从运行解释代码切换到更快编译的代码。优化基于 JVM 所做的分析和有根据的假设。如果这些假设中的任何一个 不正确,JVM 将取消优化并切换回运行解释代码。这称为混合模式执行。
下图显示了 JVM 如何执行配置文件引导的优化以及在不同执行模式之间切换的流程:
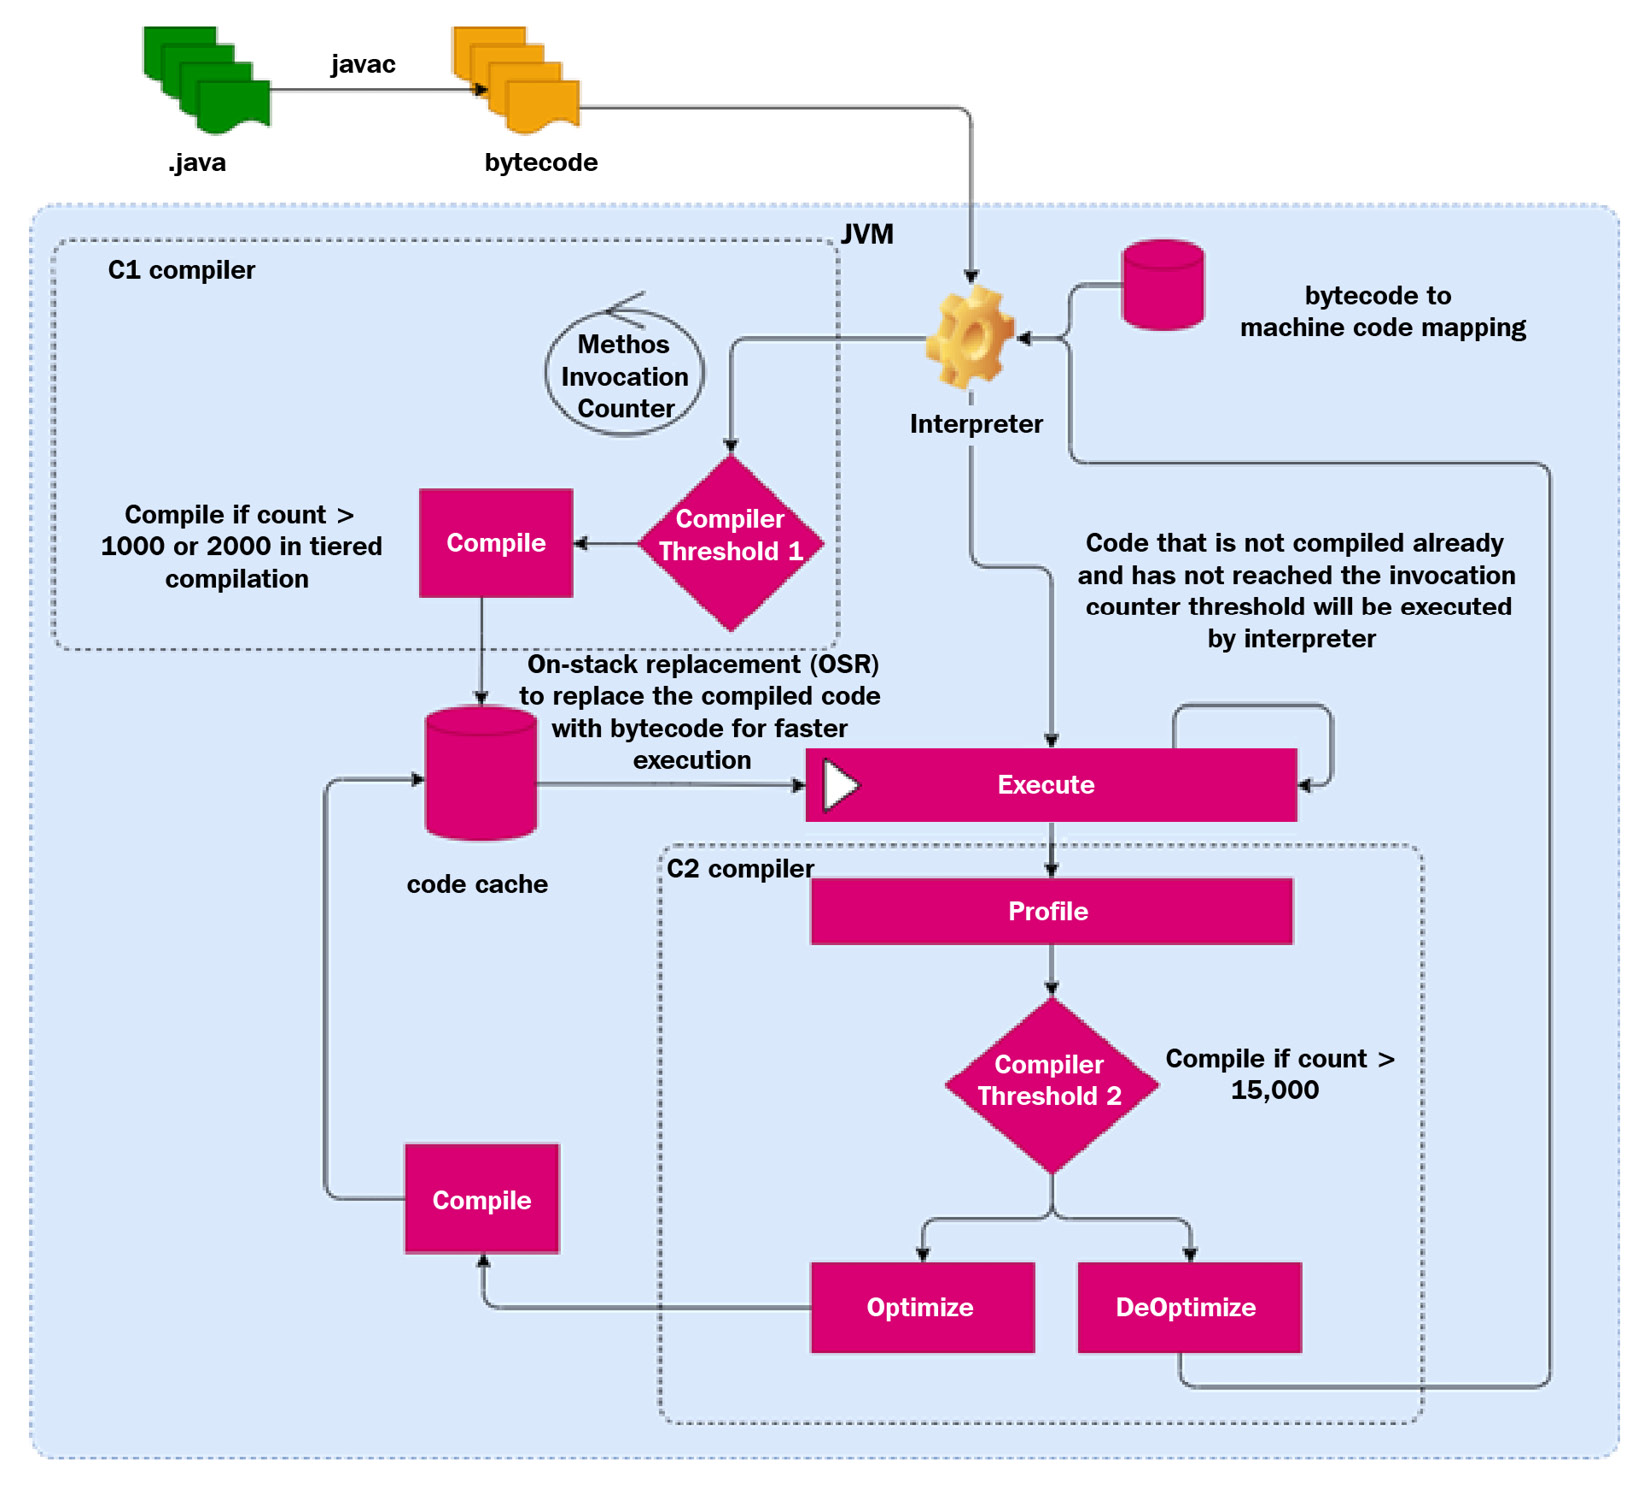
图 2.1 – JIT 编译
Java 源代码(.java)被编译成字节码(.class),这是代码的中间表示。 JVM 开始使用内置解释器运行字节码。解释器使用字节码到机器码的映射,一次将字节码指令转换为机器码一条语句,然后执行它。
在 JVM 执行这些指令时,它还会跟踪调用方法的次数。当特定方法的方法调用计数超过编译器阈值时,它会启动编译器以在单独的编译线程上编译该方法。 JVM 使用两种 类型的编译器来编译代码:C1(客户端)和 C2(服务器)JIT 编译器。编译后的代码存储在代码缓存中,因此下次调用该方法时,JVM 将执行代码缓存中的代码,而不是解释它。 JIT 编译器对代码执行各种优化,因此,随着时间的推移,应用程序的性能会更好。本节的其余部分将详细介绍这些不同的组件。
Code cache
代码缓存是 JVM 中的一个区域,JVM 存储已编译的本地方法(也称为 nmethod)。代码 缓存设置为静态大小,一段时间后可能会变满。一旦代码缓存已满,JVM 就无法编译或存储更多代码。调整代码缓存以获得最佳性能非常重要。四个关键参数可帮助我们微调 JVM 性能,并使用最佳代码缓存:
-XX:InitialCodeCacheSize: The initial size of the code cache. The default size is 160 KB (varies based on the JVM version).-XX:ReservedCodeCacheSize: The maximum size the code cache can grow to. The default size is 32/48 MB. When the code cache reaches this limit, JVM will throw a warning:CodeCache is full. Compiler has been disabled.. JVM offers theUseCodeCacheFlushingoption to flush the code cache when the code cache is full. The code cache is also flushed when the compiled code is not hot enough (when the counter is less than the compiler threshold).-XX:CodeCacheExpansionSize: This is the expansion size when it scales up. Its default value is 32/64 KB.-XX:+PrintCodeCache: This option can be used to monitor the usage of the code cache.
从 Java 9 开始,JVM 将代码缓存分为三个部分:
- Non-native method segment: This segment contains the JVM internal code (such as the bytecode interpreter). The default size of this segment is 5 MB. This can be changed using the
-XX:NonNMethodCodeHeapSizeflag. - Profiled code: This segment contains the compiled profiled code. This code is not completely optimized and has instrumentation that the profiler uses to optimize the code further. The default size is 122 MB. This can be changed using the
-XX:ProfiledCodeHeapSizeflag. - Non-profiled code: This is the fully optimized code, where even the instrumentation is removed. This can be changed using the
-XX:NonProfiledCodeHeapSizeflag.
Compiler threshold
编译阈值是帮助 JVM 决定何时执行 JIT 编译的因素。当 JVM 检测到方法执行已达到编译阈值时,JVM 将促使适当的编译器执行编译(本节稍后将对此进行详细介绍,我们将介绍各种类型的 JIT 编译器和分层编译)。
确定编译阈值基于两个关键变量。这些变量带有每个 JVM 的默认值,但也可以使用适当的命令行参数进行更改。这些变量对于调优 JVM 的性能非常关键,应该谨慎使用。这两个变量如下:
- Method invocation counter: This counts the number of times a particular method is invoked.
- Loop counter: This refers to the number of times a particular loop has completed execution (what is referred to as branching back). Sometimes, this is also referred to as Backedge Threshold or Backedge Counter.
JVM 在运行时分析这两个变量,并在此基础上决定是否需要编译该方法/循环。当达到编译阈值时,JVM 会启动一个编译线程来编译该特定方法/循环。
在执行代码时,可以使用 -XX:CompilationThreshold=N 标志作为参数来更改编译阈值。 N 的默认值是 1500 对于客户端编译器和 10000 对于服务器编译器。
On-stack replacement
达到编译阈值的方法由 JIT 编译器编译,下次调用该方法时,将调用编译后的机器码。这会随着时间的推移提高性能。但是,在长时间运行的循环达到循环计数器阈值(Backedge Threshold)的情况下,编译线程会启动代码编译。编译循环中的代码后,将停止执行并使用已编译的代码帧继续执行。此过程称为堆栈上替换 (OSR)。让我们看下面的例子。
以下代码片段仅讨论 OSR 的工作原理。为了简单起见,代码只是显示了一个长时间运行的循环,我们只是在计算循环运行的总次数。在这种情况下, main() 方法是永远不会进入的,所以即使达到编译阈值并编译代码,编译后的代码也无法使用,因为解释器继续执行执行,除非代码被替换。这就是 OSR 有助于优化此类代码的地方:
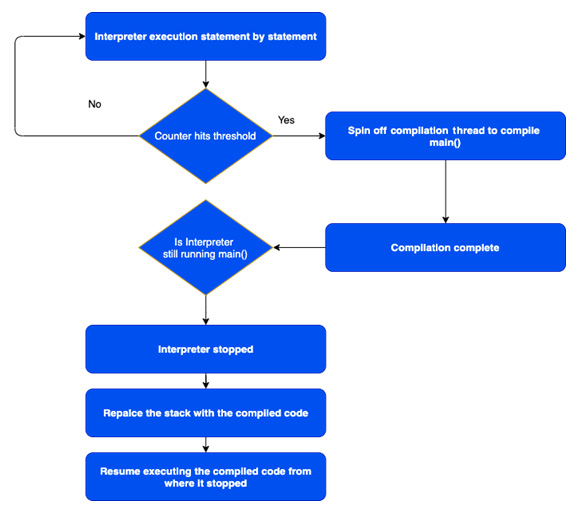
图 2.2 – OSR 流程图
让我们看看这是如何工作的:
- The interpreter starts executing the code.
- When the compiler threshold is reached, JVM spins off a compiler thread to compile the method. In the meantime, the interpreter continues to execute the statement.
- Once the compilation thread comes back with the compiled code (compilation frame), JVM checks whether the interpreter is still executing the code. If the interpreter is still executing the code, it will pause and perform OSR, and execution starts with the compiled code.
当我们使用 -XX:PrintCompilation 标志运行此代码时,这是显示 JVM 执行 OSR 的输出(% 属性表示它执行了 OSR):
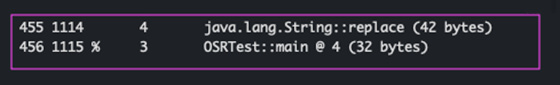
图 2.3 – OSR 日志截图
请参考下一节详细了解日志格式。
XX:+PrintCompilation
XX:+PrintCompilation 是一个非常强大的 参数,可以传递它来了解 JIT 编译器如何启动和优化代码.在我们使用这个参数运行我们的代码之前,让我们首先了解输出格式。
XX:+PrintCompilation 生成由空格分隔的参数的日志列表,格式如下:
这是输出的示例快照:
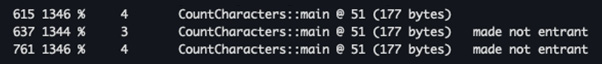
图 2.4 – 打印编译日志格式
Timestamp: This is the time in milliseconds since JVM started.CompilationID: This is an internal identification number used by JVM in the compilation queue. This will not necessarily be in a sequence, as there are background compilation threads that might reserve some of the IDs.Flags: The compiler flags are very important parameters that are logged. This suggests what attributes are applied by the compiler. JVM prints a comma-separated string of five possible characters to indicate five different attributes that are applied to the compiler. If none of the attributes are applied, it is shown as a blank string. The five attributes are as follows:一个。 On-Stack Replacement:这由
%字符表示。本节前面对 OSR 进行了说明。此属性表明当方法在一个大循环上循环时触发 OSR 编译。湾。 异常处理程序:这由
!字符表示。这表明该方法具有异常处理程序。C。 同步方法:这由
s字符表示。这表明方法是同步的。d。 阻塞模式:这由
b字符表示。这表明编译发生在阻塞模式下。这意味着编译没有在后台发生。e. Native:这由
n字符表示。这表明代码被编译为本机方法。Tier: This indicates which tier of compilation is performed. Refer to the Tiered compilation section for more details.MethodName: This column lists the method that is being compiled.MethodSize: This is the size of the method.Deoptimization performed: This shows any de-optimizations that may be performed. We will discuss this in detail in the next section.
Tiered compilation
在上一章中,我们简要介绍了编译层/级别。在本节中,我们将详细介绍。当达到编译器阈值时,客户端编译器会提前启动。服务器编译器根据分析启动。最新版本的 JVM 使用两种编译器的组合以获得最佳性能。但是,用户可以专门使用带有 -client、-server 或 -d64 参数。 JVM的默认行为是使用分层编译,这是最优化的JIT编译。使用分层编译,代码首先由客户端编译器编译,根据分析,如果代码变得更热(因此得名 HotSpot),服务器编译器就会启动并重新编译代码。这个过程在上一节中通过流程图进行了解释。
随着代码变得复杂并且运行时间更长,分层编译带来了更多优化。在某些情况下,JIT 编译比 AOT 编译运行得更好、更快。虽然 AOT 编译带来了优化,但在构建阶段,它不具备根据运行时分析来优化/反优化自身的智能。运行时分析、优化和反优化是 JIT 编译的主要优势。
JIT 编译器共有三个版本:
- C1: The 32-bit client version is for applications that we are running on 32-bit operating systems. For a 64-bit operating system, both 32-bit and 64-bit versions of the JIT compilers can be used. Typically, 32-bit versions (both client and server) are ideal for smaller heap sizes (smaller footprint). This version of the compiler can be explicitly invoked using the
-clientargument:-XX:PrintCompilation将编译过程记录到控制台。这有助于理解编译器是如何工作的。 - C2 32-bit: The 32-bit server version JIT compiler is ideal for 32-bit operating systems and applications that have a smaller footprint and do not perform extensive operations on
longordoublevariables. This version of the compiler can be explicitly invoked using the-serverargument. - C2 64-bit: The 64-bit server version JIT compiler is for 64-bit operating systems and is ideal for large applications. They have a larger footprint and are not as fast as 32-bit compilers. However, 64-bit compilers can perform faster and better. This version of the compiler can be explicitly invoked using the
-d64argument.
服务器编译器的编译速度比客户端编译器慢 4 倍。但是,它们确实生成了运行速度更快的应用程序(高达 2 倍)。
下面列出了五个层次/级别的编译级别。编译日志可用于查找哪个方法编译到什么级别,通过编译打印:
- Level 0 – Interpreted code: This the standard interpreter mode, where the JIT is still not activated. The JIT gets activated based on the compilation threshold.
- Level 1 – Simple C1 compiled code: This is a basic no-profile compilation of the code. The compiled code will not have any instrumentation.
- Level 2 – Limited C1 compiled code: In this level, basic counters are instrumented. The counter will help JVM decide to move to the next level, L2. Sometimes, when the C2 compiler is busy, JVM will use this level as an intermediate before promotion to Level 3.
- Level 3 – Full C1 compiled code: In this level, the code is fully instrumented and profiled. This detailed profiling will help decide further optimization with L4. This level adds up to 25-30% of overhead to the compiler and performance.
- Level 4 – C2 compiled code: This is the most optimized compilation of the code, where all the optimization is applied. However, while profiling, if JVM finds that the context of optimization has changed, it will deoptimize and replace the code with L0 or L1 (for trivial methods).
现在让我们看看 Java HotSpot 编译器是如何执行分层编译的。下图显示了编译的各个层和流程模式:
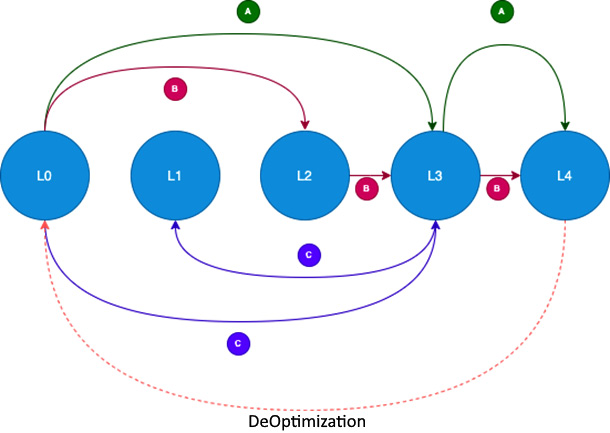
图 2.5 – 分层编译模式
- A: This is the normal pattern of how JVM works. All the code starts with L0 and escalates to L3 when the compilation threshold is reached. At L3, the code is compiled with complete detailed profiling instrumentation. The code is then profiled at runtime, when it reaches the threshold, and then the code is re-compiled with the C2 compiler (L4), with maximum optimization. C2 compilers require detailed data regarding the control flow so as to take decisions concerning optimization. Later in this section, we will walk through all the optimizations that the C2 compiler (JIT) performs. It is possible, however, that the optimizations are invalid, due to changes in the flows or the context of optimization. In this case, JVM will deoptimize and bring it back to L0.
- B: C2 Busy: C2 compilation is performed on a separate compilation thread and the compilation activities are queued. When the compilation threads are all busy, JVM will not follow the normal flow, as this may affect the overall performance of the application. Instead, JVM will escalate to L2, where at least the counters are instrumented, and at a later point, when the code reaches the higher threshold, it will escalate to L3 and L4. At any point, JVM can deoptimize or invalidate the compiled code.
- C: Trivial Code: Sometimes, JVM will compile the code to L3 and realize that the code does not require any optimization, as it is very straightforward/simple, based on the profiling. In this case, it will bring it down to L1. That way, the execution of the code will be faster. The more we instrument the code, the more overhead we are putting on the execution. It is typically observed that L3 adds anywhere between 20-30% overhead to execution, due to instrumentation code.
我们可以使用 -XX:+PrintCompilation 选项查看 JVM 的行为方式。下面是一个正常流程的例子:
对于这段代码,当 我们执行 java 和 -XX:+PrintCompilation ,控制台上会生成以下日志。可以使用 +LogCompilation 标志将日志重定向到日志文件:
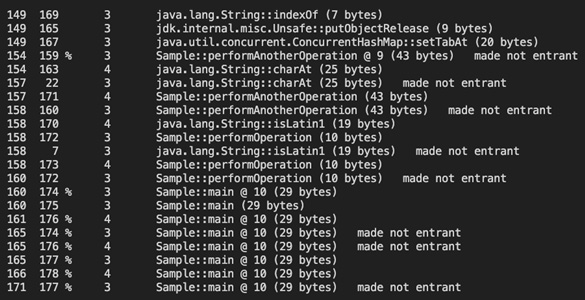
图 2.6 – 显示分层编译的日志
在此屏幕截图中,您可以看到 main() 方法如何从 L0->L3->L4 移动,这是正常流程 (A)。随着 JVM 执行优化和反优化,在这些不同的编译级别之间跳转,它达到了最优化、最稳定的点。这是 JIT 编译器相对于 AOT 编译器的最大 优势之一。 JIT 编译器使用运行时行为来优化代码执行(不仅仅是语义/静态代码优化)。如果您使用 JITWatch 运行它,我们可以看到更清晰的表示。以下屏幕截图显示了当我们通过 Sample.java 片段运行 JITWatch 工具时的编译链:
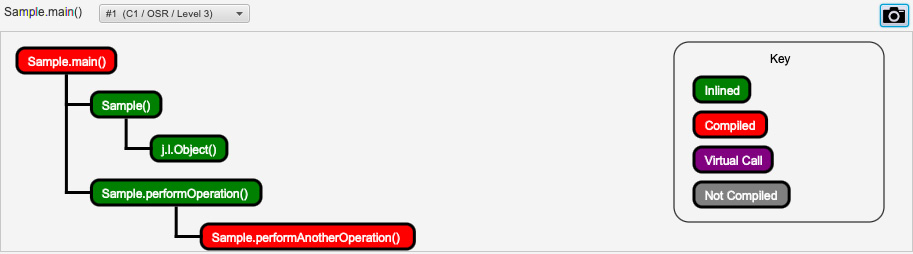
图 2.7 – JITWatch 分层编译
前面的截图显示 Sample::main() 是用 C1-L3 编译器编译的。 Sample::Sample() (默认构造函数)被内联,Sample::performOperation() 也被内联到 示例::main()。 Sample::performAnotherOperation() 也被编译。这是第一级优化:
以下屏幕截图显示了各种编译器如何在每个方法上运行:
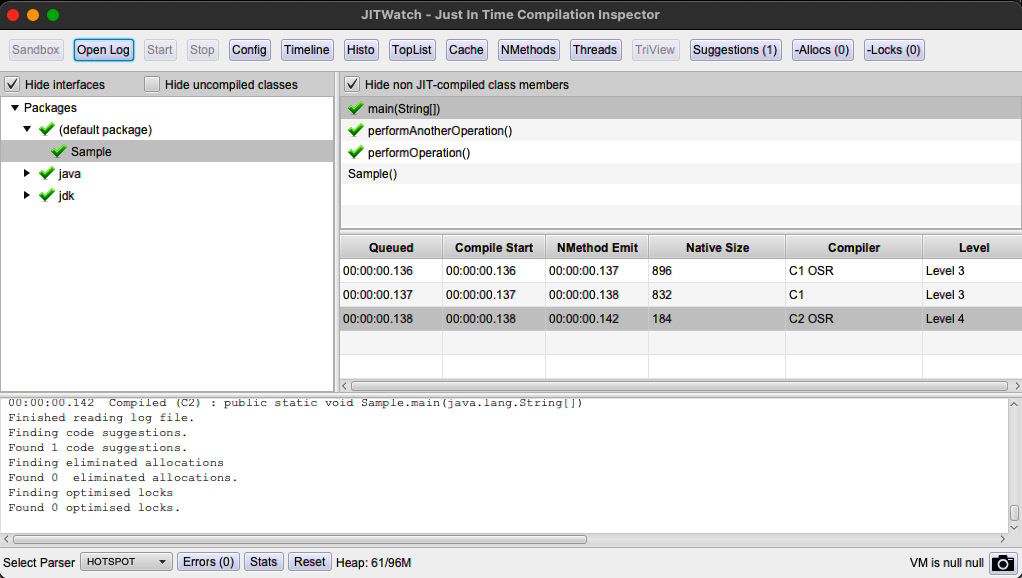
图 2.8 – main() 的 JITWatch 分层编译
此屏幕截图 显示了如何优化 main() 方法。由于 main() 方法循环较长,所以 OSR 出现了两次:一次是替换 C1 编译代码时,第二次是替换 C2 编译代码时。在每种情况下,它都执行了内联。您可以在以下屏幕截图中看到 C1 和 C2 编译器执行了哪些优化:
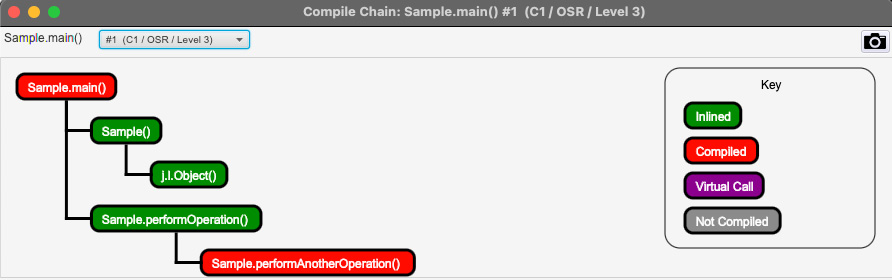
图 2.9 – main() 的 JITWatch 分层编译 – OSR-L3
在前面的截图中,我们可以看到 Sample::performAnotherOperation() 被编译并且 Sample::performOperation() 被内联进入 Sample::main()。以下屏幕截图显示了通过将 Sample:performAnotherOperation() 内联到 Sample::performOperation() 执行的进一步优化:
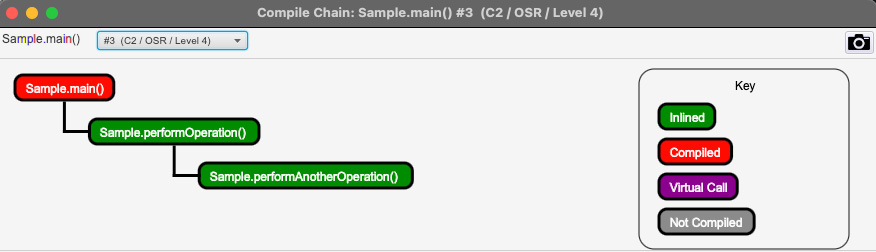
图 2.10 – main() 的 JITWatch 分层编译 – OSR-L4
现在让我们看看 JIT 编译器如何优化 Sample::performAnotherOperation() 方法:
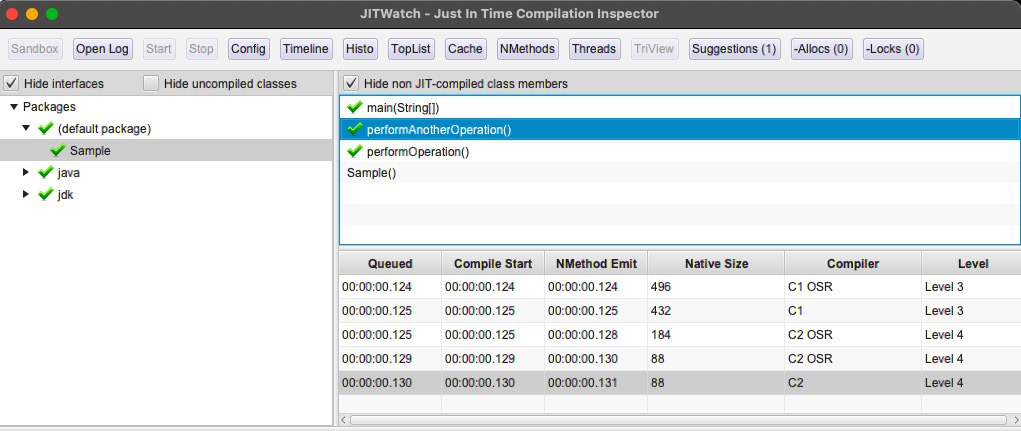
图 2.11 – performAnotherOperation() 的 JITWatch 分层编译
正如我们在前面的截图中看到的,Sample::performAnotherOperation() 已经经历了各种优化和 OSR,因为它运行了一个长循环。代码在达到编译器阈值时被内联到 Sample::performOperation() 中。以下屏幕截图显示了 Sample::performAnotherOperation() 是如何编译并内联到 Sample::performOperation() 中的。
现在让我们看看 JIT 编译器 是如何编译 Sample::performOperation() 方法的:
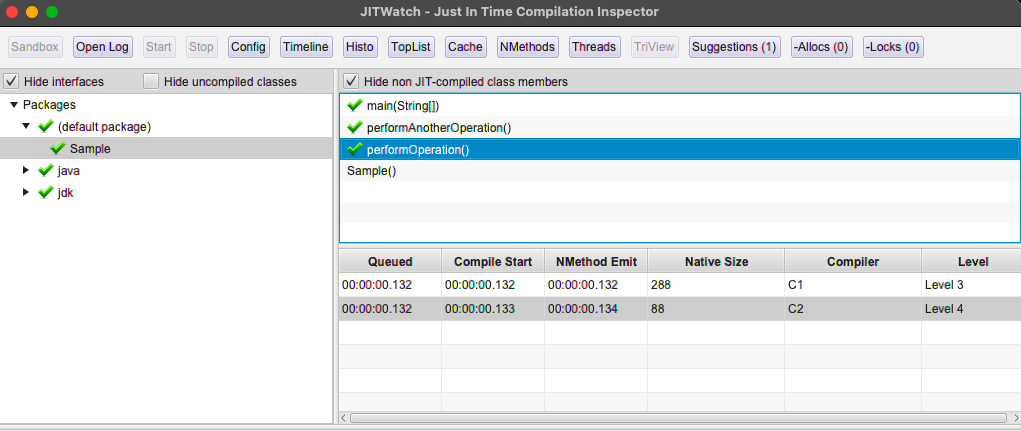
图 2.12 – performOperation() 的 JITWatch 分层编译
以下屏幕截图显示了 performOperation() 方法的 C1 编译链视图:
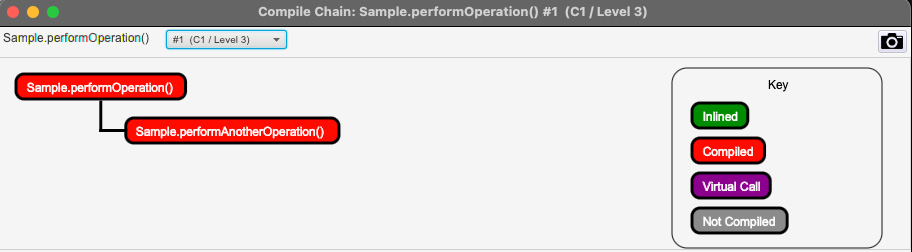
图 2.13 – JITWatch 分层编译 performOperation() – C1 编译链视图
前面的屏幕截图显示 Sample::performAnotherOperation() 在达到 编译器阈值时被编译,下面的屏幕截图显示编译后的代码被内联到 Sample::performOperation() 中:
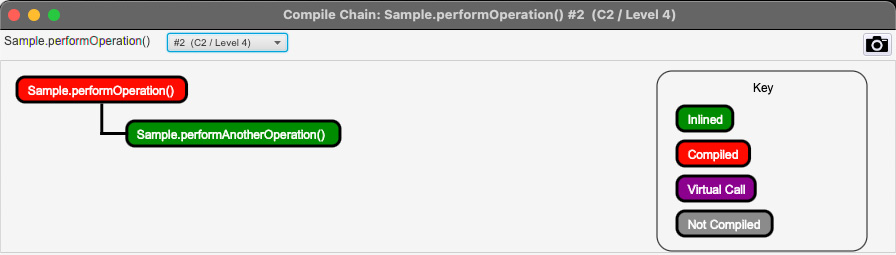
图 2.14 – JITWatch 分层编译 performOperation() – C2 编译链视图
JITWatch 可用于详细了解 C1 和 C2 编译器的行为方式以及优化的执行方式。这有助于反映应用程序代码,并主动更新源代码以获得更好的运行时性能。为了更好地理解 C2 编译器如何优化代码,现在让我们看看 JVM 在编译期间应用的各种类型的代码优化。
Understanding the optimizations performed by JIT
本节将介绍 JIT 编译器在各个编译级别采用的各种优化技术。
Inlining
调用方法对于 JVM 来说是一个昂贵的 操作。当程序调用一个方法时,JVM 必须为该方法创建一个新的堆栈帧,将所有值复制到堆栈帧中,然后执行代码。一旦方法完成,堆栈帧必须在执行后进行管理。面向对象编程的最佳实践之一是通过访问方法(getter 和 setter)访问对象成员。
内联是 JVM 执行的最有效的优化之一。 JVM 将方法调用替换为代码的实际内容。
如果我们使用以下命令运行之前的代码,我们可以看到 JVM 是如何执行内联的:
在这种情况下,对 performOperation() 方法的调用将替换为内联 main() 方法的内容。有效内联后,main() 方法将如下所示:
可以使用 -XX:-Inline 标志禁用内联。
JVM 决定 内联代码,基于对方法的调用次数和方法的大小,如果方法被频繁调用(热),大小该方法的字节数<325字节。默认情况下内联小于 35 字节的方法。这些数字可以分别使用命令行中的 -XX:+MaxFreqInlineSize 和 -XX:+MaxInlineSize 标志来更改。
Monomorphic, bimorphic, and megamorphic dispatch
多态性是 关键的面向对象概念之一,它提供了一种基于上下文动态加载类的方法,并且行为是动态决定的。接口和继承是最广泛使用的多态实现中的两个。但是,这会带来性能 开销,因为 JVM 会动态加载类/接口实现。内联实现成为一个挑战。
JVM 配置文件的一件事是调用特定实现的次数以及给定基类或接口实际存在多少派生类/接口实现。如果分析器只识别一个实现,那么它被称为单态。如果找到两个,则称为bimorphic,megamorphic 表示有多个实现。
基于分析,JIT 编译器识别使用了哪个特定的派生类对象(或接口实现),并决定内联该特定实现,以克服多态性的性能开销。单态和双态易于内联。 JIT 分析器跟踪执行路径并识别 在哪个上下文中使用了哪个实现并执行内联。超态实现内联起来很复杂。以下代码片段显示了多态性。我们将使用此代码来了解性能开销:
在前面的代码中,我们定义了一个接口,叫做Shape,而我们接口有三种实现,分别是Circle、正方形和三角形。而且,我们正在使用一个开关来初始化正确的类。这里有两种优化场景:
- If the JIT knows that a particular implementation is used, it optimizes the code and might perform an inline. This is called a monomorphic dispatch.
- If, let's say, the decision is to be taken based on a particular variable or a configuration, JIT will profile, which is the most optimistic assumption it can take, and only those classes and inline them, and may also use an uncommon trap. In case the implementation class that is used is different from what is assumed, the JIT will deoptimize.
Dead code elimination
JIT 编译器识别在分析时从未执行或不需要的代码。这称为死代码,JIT 编译器将其从执行中消除。现代 IDE 识别死代码;这纯粹基于执行的静态代码分析。 JIT 编译器不仅消除了这些琐碎的代码,还消除了运行时基于控制流的代码。死代码消除是提高性能的最有效方法之一。
我们以下面的代码为例:
在这段代码中,calculateSomething() 方法有一些逻辑。让我们看一下前面的代码片段。 finalTotalValue 变量被初始化,之后,通过调用 calculateValue() 计算总数 方法在循环中,但假设 finalTotalValue 在计算后从不使用。初始化代码、数组堆分配代码、调用calculateValue()方法的循环,都是死代码。 JIT 在运行时理解这一点并将其完全删除。
JIT 根据分析和代码是否可达来做出这些决定。它可能会删除不必要的 if 语句(尤其是空检查;如果对象从未被视为空 - 这种技术有时称为空检查消除)。它将用所谓的“不常见陷阱”代码替换它。如果此执行到达此陷阱代码,它将取消优化。
通过消除代码放置“不常见陷阱”代码的另一种情况是通过预测分支。基于 profiling,JIT 假设并预测一个分支代码(if, switch
,等等)可能永远不会被执行,并消除该代码。
公共子表达式消除是 JIT 用来消除代码的另一种有效技术。在这种技术中,一个中间子表达式被删除以节省指令的数量。
稍后,在转义分析部分,我们还将看到一些基于JIT执行的转义分析的代码消除技术。
Loop optimization – Loop unrolling
循环展开是另一种有效的优化技术。这在较小的循环体和大量迭代中更有效。该技术涉及通过替换代码来减少循环中的迭代。这是一个非常简单的例子:
这可以归结为以下内容:
在此示例中,JIT 编译器决定将迭代次数减少 1/4,方法是调用 somefunction() 四次而不是一次。这显着提高了性能,因为跳转语句的数量 减少了 1/4。当然,四个的决定是根据数组的大小来决定的,这样数组引用就不会越界。
Escape analysis
转义分析是 JIT 编译器执行的最高级优化之一。这由命令行中的 -XX:+DoEscapeAnalysis 标志控制。这是默认启用的。
在上一章中,我们介绍了 内存子系统 部分中的各种内存区域。堆和栈是两个最重要的内存区域。堆内存区域可跨 JVM 中的各种线程访问。堆不是线程安全的。当多个线程访问堆中存储的数据时,建议通过获取同步锁来编写线程安全的代码。这会阻止其他线程访问相同的数据。这对性能有影响。
堆栈内存是线程安全的,因为它是为特定的方法调用分配的。只有方法线程可以访问该区域,因此无需担心获得同步锁或没有阻塞线程。
JIT 编译器对代码进行详细分析,以识别我们在堆中分配变量的代码,但仅在特定方法线程中使用它们,并决定将这些变量分配到“堆栈区域”而不是“堆”区域。”这是 JIT 编译器执行的最复杂的优化之一,对性能有巨大的影响。 JIT 可能决定将变量存储在 PC 寄存器中以便更快地访问。
JIT 还寻找 synchronized 和跟踪的使用。如果它被单个线程调用,JIT 决定忽略 synchronized。这对性能有很大影响。 StringBuffer 是线程安全的对象之一,具有很多同步方法。如果 StringBuffer 的实例未在单个方法之外使用,JIT 决定忽略 synchronized。这种技术有时被称为“锁省略”。
在同步锁 不能被忽略的情况下,JIT 编译器会寻找组合 同步 块。这种技术被称为锁粗化。这种技术会寻找后续的 同步 块。这是一个例子:
在这个例子中,两个后续的同步块试图获得同一个类的锁。 JIT 编译器会将这两个块合并为一个。
JIT 对使用循环创建且从未在循环外使用的变量执行类似的分析。有一种称为“标量替换”的非常复杂的技术,其中 JIT 配置文件用于创建对象,但在未使用的对象中只使用了几个成员变量。 JIT 将决定停止创建对象并直接用成员变量替换它们。这是一个非常简单的例子:
StateStoring 类是一个简单的类,我们在其中存储具有两个成员的对象的状态 - state_variable_1 和 state_variable_2。 JIT 为各种迭代分析此对象,并检查此对象是否已创建并且从未在范围之外使用。它甚至可能决定不创建对象,而是用 实际标量(局部变量)替换对象 getter 和 setter。这样,可以避免整个对象的创建和销毁(这是一个非常昂贵的过程)。
下面是一个更高级的例子,这次让我们看看 JITWatch 是如何显示逃逸分析的:
在此代码片段中,allocateObjects() 方法是 创建一个数组(在堆上)并将该值添加到数组中. dummyInt 变量的范围仅限于 allocateObjects()for 循环> 方法。无需在堆中创建这些对象。执行转义分析后,JIT 确定这些变量可以放入堆栈帧中。
以下 JITWatch 屏幕截图演示了这一点:
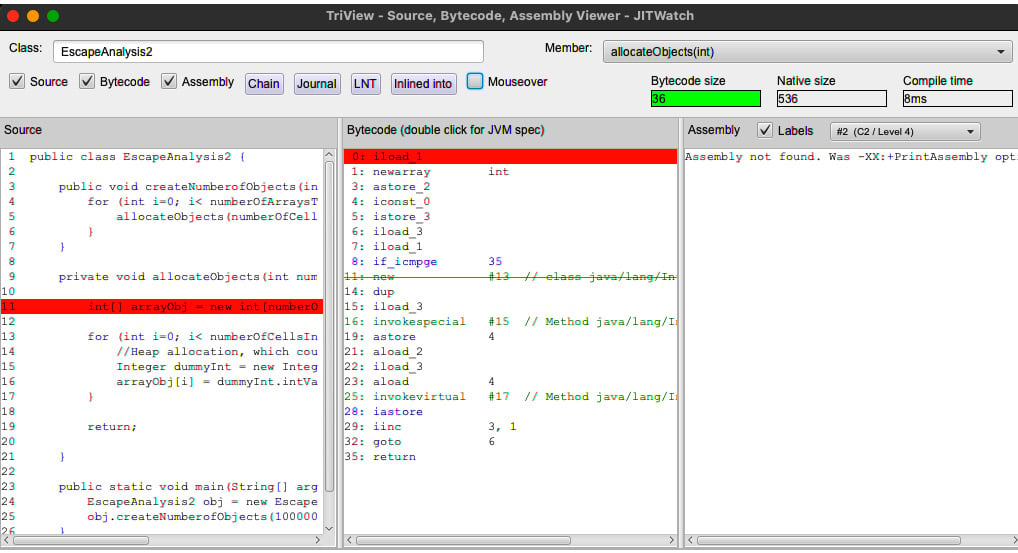
图 2.15 – JITWatch 逃逸分析 – 1
在此屏幕截图中,分配 dummyInt 的 字节码被删除,表示不需要为该变量分配堆:
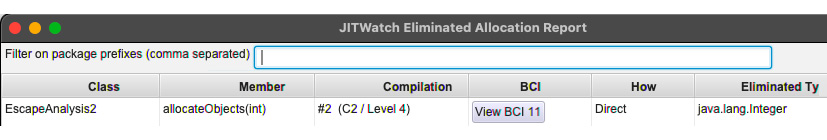
图 2.16 – JITWatch 逃逸分析 – 2
上一个屏幕截图显示了 C2/Level 4 执行的优化,其中删除了变量的分配。
Deoptimization
在上一节中,我们查看了 JIT 编译器执行的各种优化技术。 JIT 编译器根据分析,使用它做出的一些假设来优化代码。有时,这些假设在不同的上下文中可能不正确。当 JIT 偶然发现这些场景时,它会取消优化代码并返回使用解释器来运行代码。这称为去优化,会对性能产生影响。
有两种情况会发生反优化:
- When the code is "non-entrant"
- When the code is "zombie"
让我们借助示例来了解这些场景。
Non-entrant code
代码无法进入的情况有两种:
- Assumptions made during polymorphism: As we discussed in the section on monomorphic dispatch, polymorphism has a significant performance overhead on JVM. One of the optimizations that JIT performs is assuming a particular implementation of the interface/base class, and inlines that particular implementation of the interface/class. This is done based on the context and the control path that the JIT observed during profiling. When the assumption is invalid, JIT generates a deoptimization trap, and this optimized code is rendered "non-entrant". We can see when the JIT is making the code non-entrant with the
-XX:+PrintCompilationflag. - Escalations that happen during tiered compilation: When JIT decides to move between the level discussed in the Tiered compilation section, it marks the code that was optimized in the previous level as non-entrant, and the next level of the compilation process will optimize the code and replace the previous optimizations. This happens when JVM replaces the code that is compiled by C1 with the code that C2 has compiled. The following screenshot demonstrates an example when we run out
Sample.java:
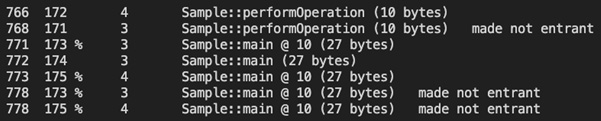
图 2.17 – 分层编译升级
在前面的屏幕截图中,我们可以看到分层编译的运行情况(第三列显示层数)和已完成的优化。
Zombie code
在大多数情况下,某些对象 在标记为非进入的代码堆中创建。一旦 GC 回收了所有这些对象,JVM 就会将这些类的方法标记为僵尸代码。然后 JVM 从代码缓存中删除这个编译的僵尸代码。正如我们在深入探讨热点和 C2 JIT 部分中所讨论的,保持代码缓存处于最佳状态非常重要,因为这会对性能产生重大影响。
正如我们在分层编译中看到的那样,当 Java JIT 所做的任何假设在运行时受到控制流的挑战时,就会执行去优化。在下一节中,我们将简要介绍 Graal JIT 编译器,以及它是如何插入 JVM 的。
Graal JIT and the JVM Compiler Interface (JVMCI)
在前面的部分中,当我们 了解 JIT 编译器 所经历的各种特性和改进时,很明显 C2 是非常复杂。但是,C2 编译器实现有其缺点。 C2 是用 C/C++ 语言实现的。虽然 C/C++ 速度很快,但它不是类型安全的,也没有垃圾收集。因此,代码变得非常复杂。 C2 实现非常复杂,因为更改代码以进行新的增强和错误修复变得越来越复杂。
与此同时,Java 已经成熟,在许多情况下运行速度与 C/C++ 一样快。 Java 具有垃圾收集的类型安全性。 Java 比 C/C++ 更简单、更易于管理。 Java 的主要优势在于其 异常处理能力、内存管理、更好的 IDE/分析和工具支持。 JIT 编译器只不过是一个接收字节码 byte[] 的程序,对其进行优化、编译并返回一组机器代码 字节[]。这可以很容易地用Java 实现。我们需要的是一个 JVM 接口,它可以提供实现自定义编译器逻辑的协议。这将有助于为 JIT 编译器的新实现打开 JVM。
JDK增强提案JEP243(https://openjdk.java.net/jeps/243)是一个提议提供一个编译器接口,以便用 Java 编写编译器并扩展 JVM 以动态使用它。
JEP243 是在 Java 9 中添加的。这是对 JVM 最重要的增强之一。 JVMCI 是 JEP243 的实现。 JVMCI 提供了编写我们自己的 JIT 编译器所需的可扩展性。 JVMCI 提供了实现自定义编译器和配置 JVM 以调用这些自定义编译器实现所需的 API。 JVMCI API 提供以下功能:
- Access to VM data structures, which is required to optimize the code
- Managing the compiled code following optimization and deoptimization
- Callbacks from JVM to execute the compilation at runtime
可以使用以下命令行标志执行 JVMCI:
Graal 是 JVMCI 的实现,它带来了现代 Java 运行时所需的所有关键特性和优化。 Graal 完全用 Java 实现。 Graal 不仅仅是一个 JIT 编译器。以下是 Graal JIT 和 JVM JIT (C2) 之间的快速比较:
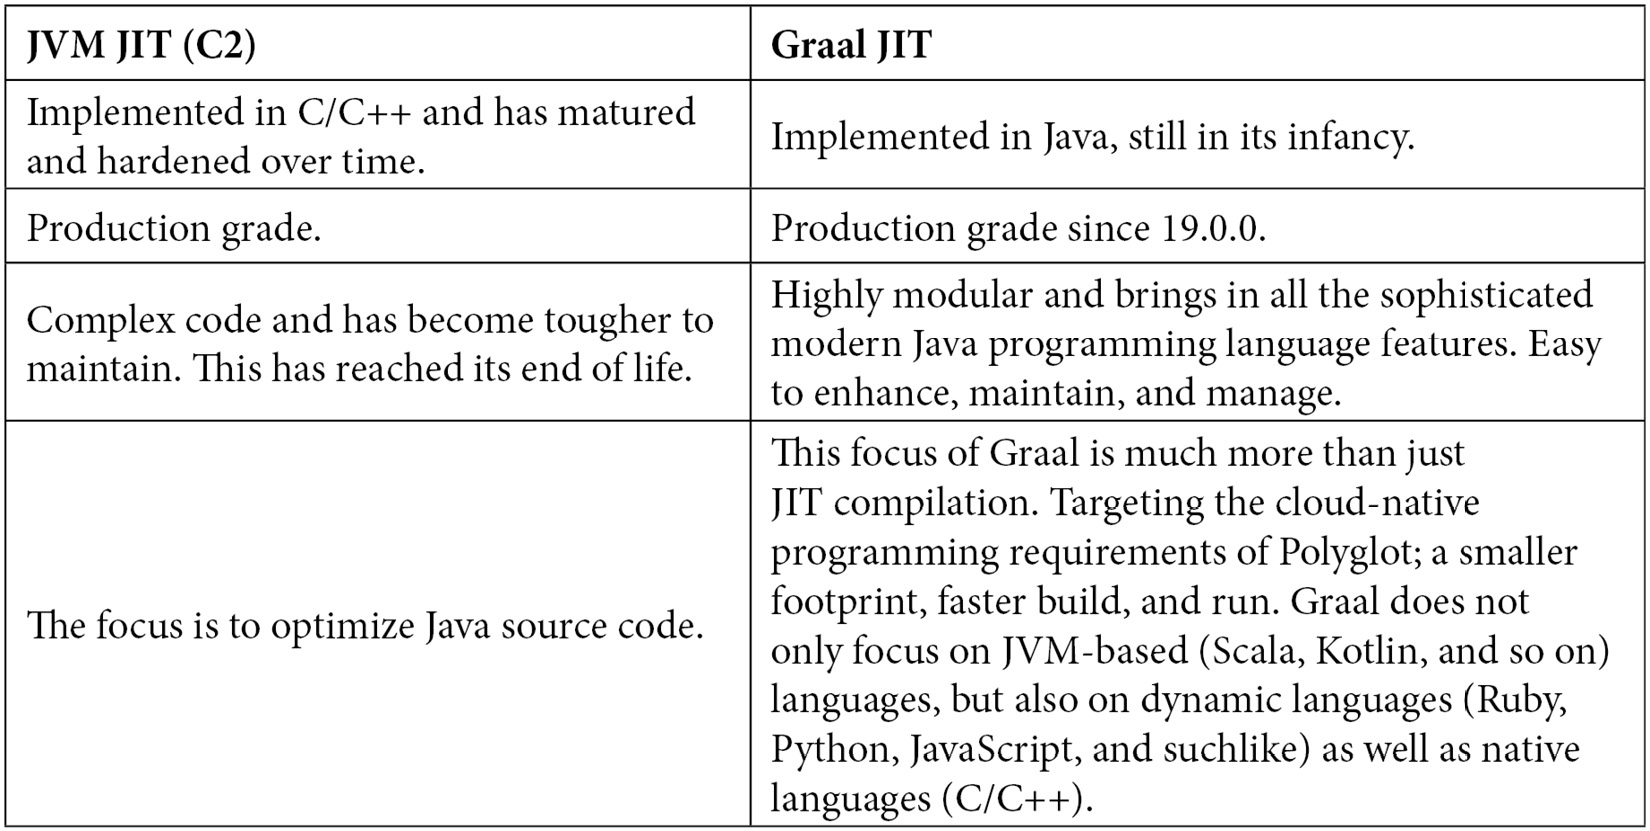
下一章将详细介绍 Graal 架构,以及第 4 章,Graal Just-In-Time Compiler,将更深入< /a> 了解 Graal JIT 的工作原理,以及它如何构建在 Java JIT 之上并为 Polyglot 带来更高级的优化和支持。
Questions
- What is a code cache?
- What are the various flags that can be used to optimize a code cache?
- What is the compiler threshold?
- What is on-stack replacement?
- What is tiered compilation? What are the various patterns of tiered compilation?
- What is inlining?
- What is monomorphic dispatch?
- What is loop unrolling?
- What is escape analysis?
- What is Deoptimization?
- What is JVMCI?
Further reading
- Introduction to JVM Languages (https://www.packtpub.com/product/introduction-to-jvm-languages/9781787127944)
- Java SDK documentation (https://docs.oracle.com)
- GraalVM documentation (https://docs.oracle.com/en/graalvm/enterprise/19/guide/overview/compiler.html)
- JITWatch documentation (https://github.com/AdoptOpenJDK/jitwatch)