读书笔记《building-distributed-applications-in-gin》第10章捕获Gin应用程序指标
Chapter 10: Capturing Gin Application Metrics
在最后一章中,您将学习如何近乎实时地调试、故障排除和监控 RESTful API。您还将学习如何收集 Gin 应用程序指标以衡量 Gin 应用程序的性能并分析异常行为。除此之外,您还将探索如何使用 ELK 堆栈将 Gin 调试日志流式传输到集中式日志平台。
因此,我们将涵盖以下主题:
- Exposing Gin application metrics with Prometheus
- Monitoring server-side metrics
- Streaming Gin logs to the ELK platform
在本章结束时,您将能够检测和监控在生产中运行的 Dockerized Gin Web 应用程序,并轻松调试其日志。
Technical requirements
要遵循本章中的内容,您将需要以下内容:
- A complete understanding of the previous chapter. This chapter is a follow-up to the previous one as it will use the same source code. Hence, some snippets won't be explained to avoid repetition.
- It is assumed that you already have knowledge of Docker and containerization.
本章的代码包托管在 GitHub 上,地址为 https: //github.com/PacktPublishing/Building-Distributed-Applications-in-Gin/tree/main/chapter10。
Exposing Gin metrics with Prometheus
在上一章中,您学习了如何自动化 Gin 应用程序的部署过程。但是,没有任何应用程序可以免受停机或外部攻击 (DDoS)。这就是为什么您需要设置正确的工具来持续监控应用程序的性能。 Prometheus (https://prometheus.io) 是一个用于监控应用程序的常用开源工具。
您可以通过在终端会话中运行以下命令来安装 Go 客户端:
接下来,更新 main.go 文件,使其在 /prometheus 路径上公开 HTTP 路由。路由处理程序将调用 Prometheus HTTP 处理程序,该处理程序将返回运行时和应用程序指标列表:
然后,导入以下包以使用 promhttp 结构:
接下来,重新部署应用程序。如果您导航到 http://localhost:8080/prometheus,您应该会看到以下指标:
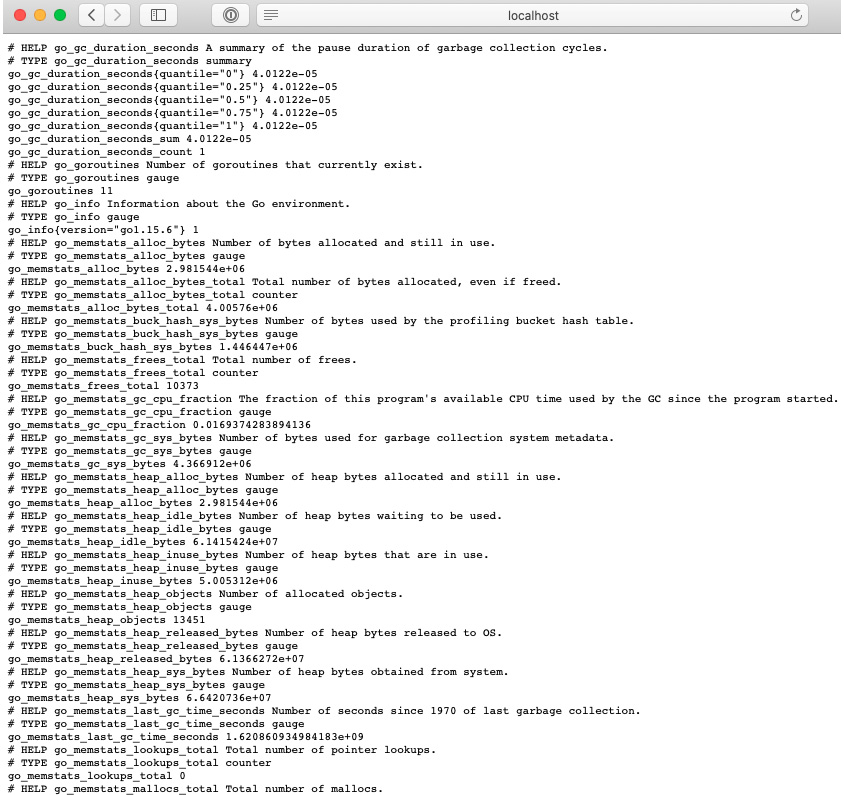
图 10.1 – Prometheus 默认指标
此应用程序仅公开默认指标。您还可以通过检测 Gin 应用程序代码来公开您自己的自定义指标。让我们学习如何做到这一点。
Instrumenting a Gin application
检测是监控和测量性能、检测错误以及获取代表应用程序状态的跟踪信息的能力。 Prometheus 允许我们注入代码来近距离监控 Gin 应用程序。
要添加自定义指标,例如计算传入请求的数量,请执行以下步骤:
- First, we need to create a piece of middleware to intercept incoming HTTP requests and increment the counter:
- Then, we must define a piece of Gin middleware with the following code block:
- Next, register the
totalRequestscounter within theinit()method's body: - Then, pass the
PrometheusMiddlewaremiddleware to the Gin router: - Restart the application and then refresh the
/prometheusURL.
在响应中,您将看到每个路径的请求数:
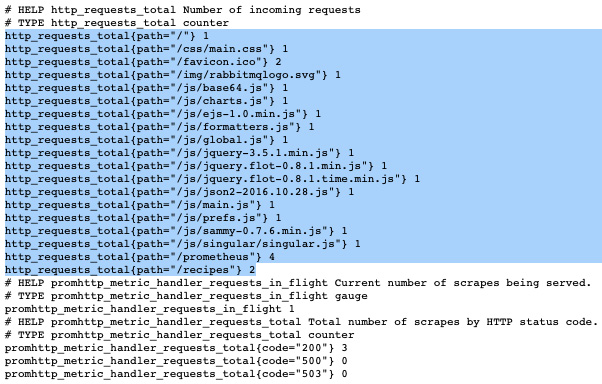
图 10.2 – 检测 Gin 代码
笔记
由于您没有经常访问该应用程序,因此您的输出可能不会显示与我一样多的数据。获取更多数据的最佳方法是向 Recipes API 发出多个 HTTP 请求。
您可以公开的另一个有用的 指标是每个 HTTP 方法已接收的 HTTP 请求数。同样,定义一个全局计数器并为相应的 HTTP 方法递增计数器:
在 init() 方法体内注册 totalHTTPMethods 计数器并重新启动应用程序。
重新启动应用程序 后,在响应负载中,您应该会看到按 HTTP 方法划分的请求数:
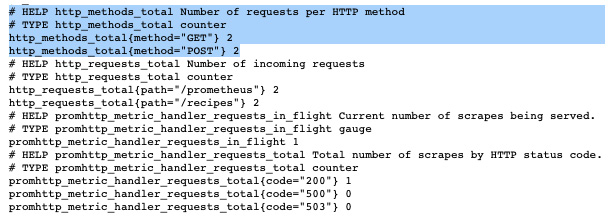
图 10.3 – 每个 HTTP 方法的请求数
您还可以使用以下代码块以秒为单位记录 HTTP 请求延迟。我们使用 Histogram 而不是 Counter 来计算来自传入的单个观察值HTTP 请求:
因此,您应该有类似于以下内容的内容:
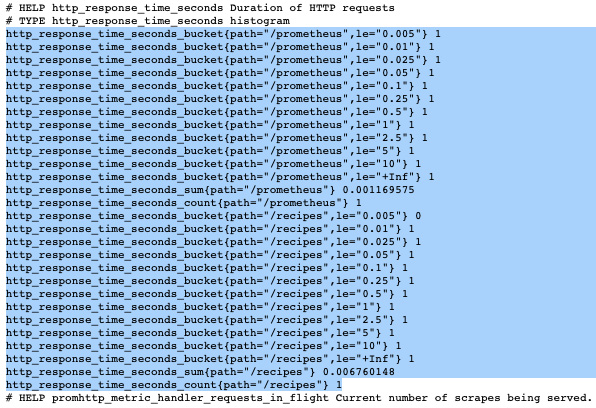
图 10.4 – HTTP 请求的持续时间
现在指标 已经公开,您可以将它们存储在时间序列数据库中,并在此基础上构建交互式仪表板。定期了解应用程序的工作原理可以帮助您确定优化其性能的方法。
笔记
另一种选择是使用以下由开源社区编写的 Go 库:https://github。 com/zsais/go-gin-prometheus。它带有一组通用的指标。
要开始,请按照下列步骤操作:
- Deploy Prometheus by using the official Docker image with the following
docker-compose.ymlfile:Prometheus 容器使用
prometheus.yml配置文件,它定义了一个后台作业来抓取 Golang Prometheus 指标端点: - Redeploy the application stack with the following command:

图 10.5 – Docker 堆栈日志
- Navigate to the Prometheus dashboard by visiting
localhost:9090in your favorite browser. You can explore the available metrics by using the search bar and writing queries using the Prometheus Query Language (PromQL). Prometheus collects metrics by polling (scraping) instrumented Gin code:
图 10.6 – 从 Prometheus 仪表板探索指标
- Turn the metrics into a chart by clicking on the Graph tab:

图 10.7 – 使用 Prometheus 的内置图形功能
您可以使用 Grafana 等可视化平台构建高级图表。它汇总和可视化存储在 Prometheus 中的数据,并提供广泛的 UI 组件来构建用户友好的仪表板。监控工作流程如下图所示:

图 10.8 – 使用 Prometheus 和 Grafana 收集 Gin 指标
- Deploy Grafana inside a Docker container with the following code snippet:
- Spin up the container using the following command:
- Head to
localhost:3000; you'll be asked to enter some user credentials. The defaults are admin for both the username and password:
图 10.9 – Grafana 登录页面
- Next, connect to Prometheus by creating a data source. Click on Configuration from the sidebar. Within the Data Sources tab, click on the Add data source button:

图 10.10 – 添加一个新的数据源
- After that, select Prometheus and then fill in the fields, as shown in the following screenshot. Then, click on the Save & Test button at the bottom of the page:
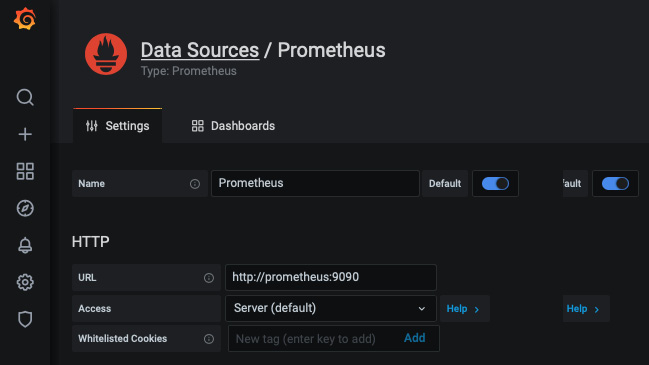
图 10.11 – 配置 Prometheus 数据源
您现在已准备好创建您的第一个 Grafana 仪表板!
您可以先点击New Dashbord/添加面板来创建图表。在查询字段中输入 http_requests_total 表达式,同时使用 Metrics 下拉菜单通过自动完成查找指标。通过在 legend 字段中键入 {{path}} 关键字,仅显示返回结果的路径标签。
您现在应该有 以下图形配置,它表示每个路径随时间变化的 HTTP 请求总数:
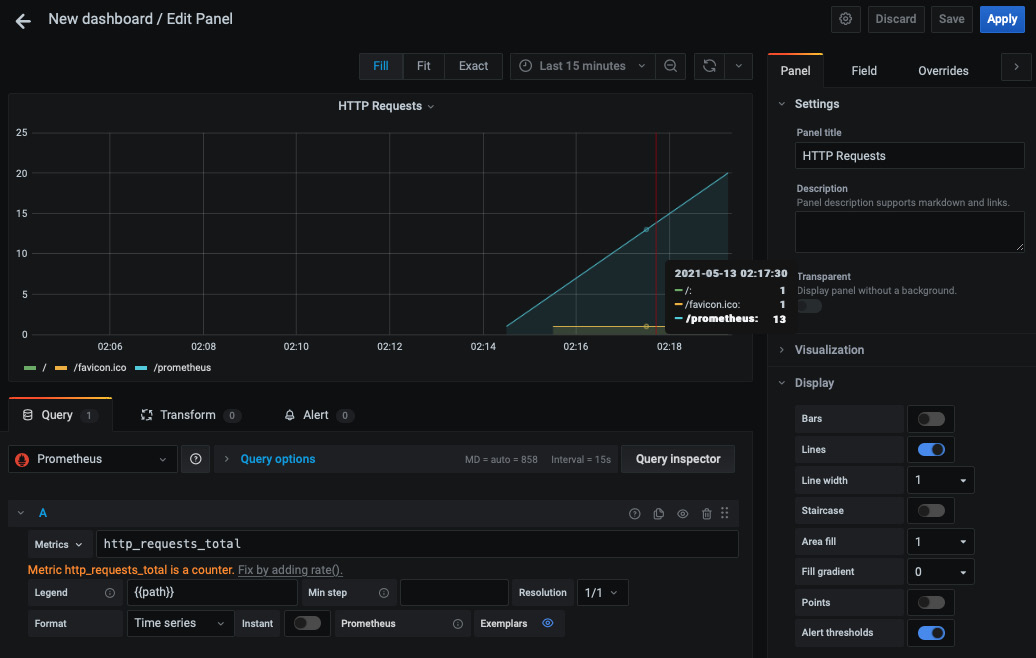
图 10.12 – HTTP 请求总数
保存面板并创建一个新面板,以使用 http_response_time_seconds_sum 表达式显示所服务的 HTTP 请求随时间变化的响应时间:
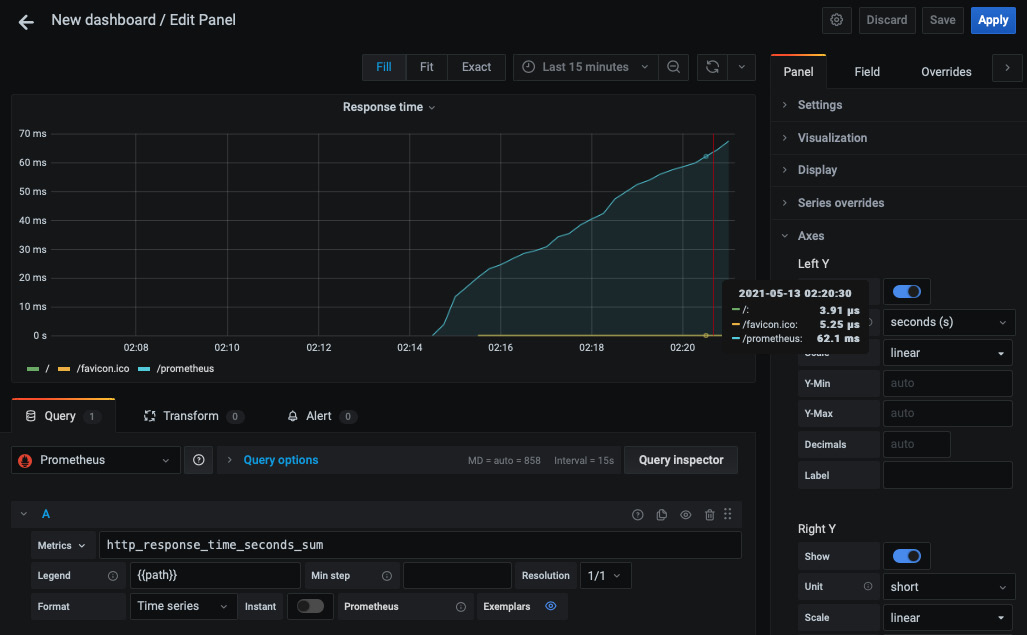
图 10.13 – HTTP 响应时间
您还可以使用以下配置创建单个统计计数器来显示每个 HTTP 方法的请求总数:
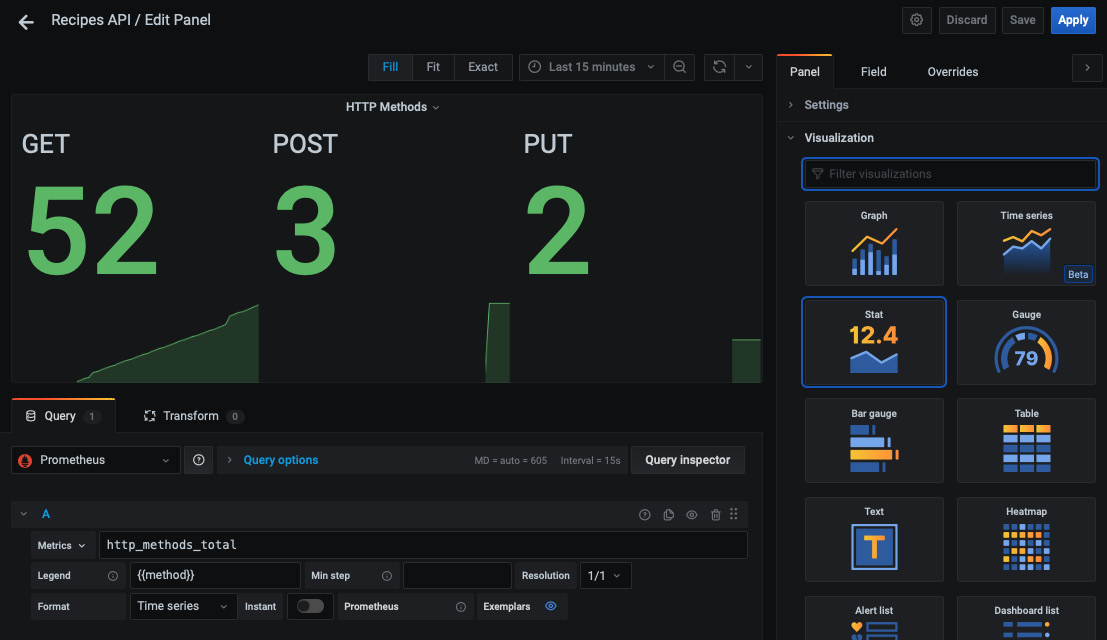
图 10.14 – 使用 Grafana 的单一统计组件
您可以通过添加其他带有指标的面板来体验仪表板,并根据自己的喜好对其进行自定义:
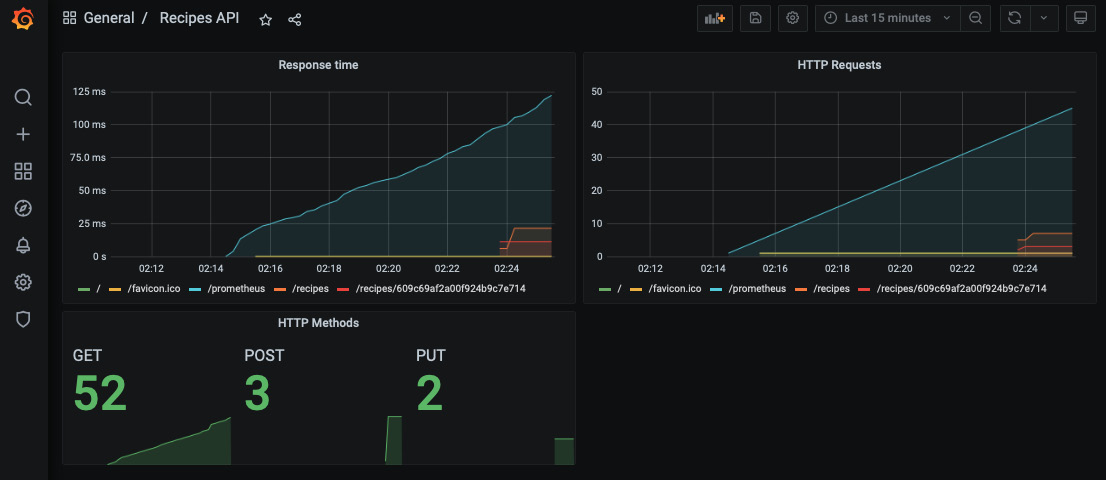
图 10.15 – 交互式和动态 Grafana 仪表板
笔记
您可以从 chapter10 文件夹下的 GitHub 存储库下载 dashboard.json,其中包含上述仪表板的 Grafana 配置。
Monitoring server-side metrics
到目前为止,您已经了解了如何通过检测 Gin 应用程序代码来监控应用程序端指标。在本节中,您将学习如何公开服务器端指标并监控在 Gin 分布式 Web 应用程序上运行的容器的整体健康状况。
要收集服务器端指标,您可以使用名为 Telegraf (https://github.com/influxdata/telegraf),数据收集代理(DCA),它可以从多个输入中收集指标并将它们转发到不同的来源:
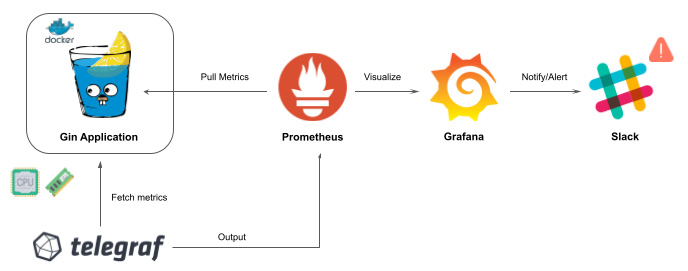
图 10.16 – 使用 Telegraf 代理收集服务器端指标
Telegraf 可以使用 Docker 轻松部署。将以下代码块添加到 docker-compose.yml:
telegraf.conf 包含 Telegraf 将从其中获取数据的数据源 (inputs) 列表。它还包含数据将被转发到的目的地列表(输出)。在以下配置文件中,Telegraf 将收集有关服务器资源(内存、CPU、磁盘和网络流量)和 Docker 守护进程(每个容器的资源使用情况)的指标,然后将这些指标转发到 Prometheus 服务器:
笔记
您还可以将这些指标转发到 InfluxDB (https://github.com/influxdata/influxdb),a 可扩展的时间序列数据库,并将其连接到 Grafana。
接下来,在 prometheus.yml 中定义一个新作业,以抓取 Telegraf 容器公开的指标:
完成后,使用以下命令重新启动堆栈:
然后,返回 Prometheus 仪表板并从 Status 下拉列表中导航到 Targets。 Telegraf 目标应该已添加到列表中:
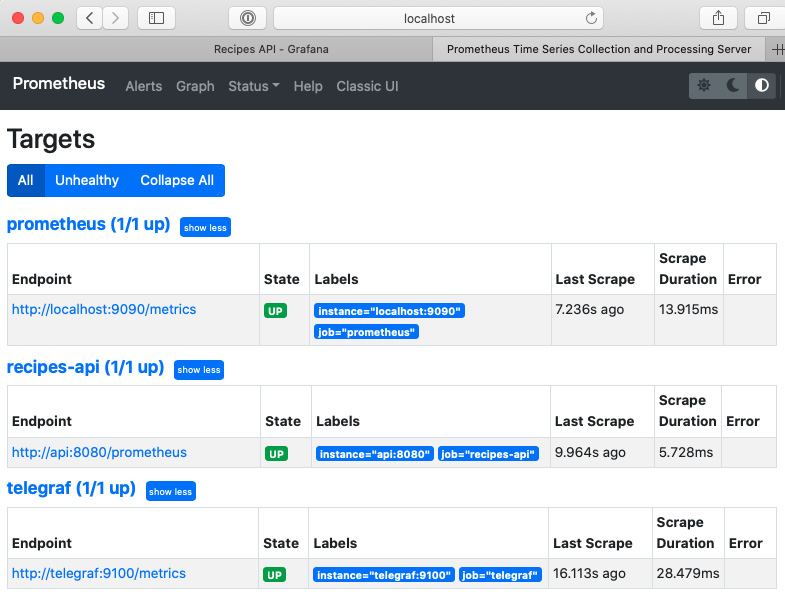
图 10.17 – Telegraf 作业启动并运行
借助 Prometheus 现在提供的 服务器端指标,您可以在 Grafana 中创建其他面板。
例如,您可以从 Metrics 下拉列表中选择 docker_container_mem_usage_percent 表达式来监控每个容器的内存使用情况:
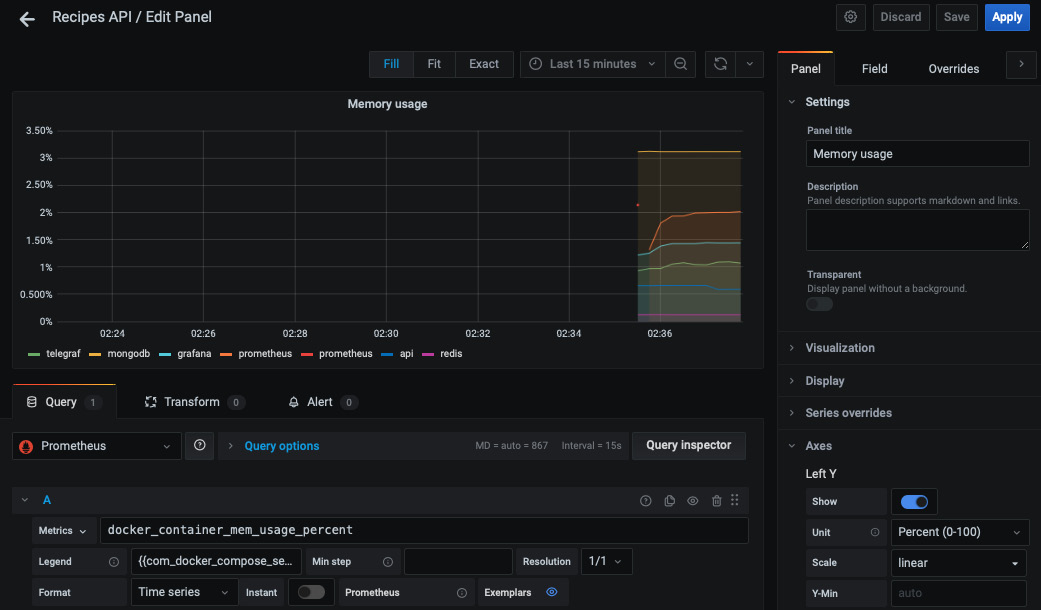
图 10.18 – 每个容器的内存使用情况
添加额外的 指标,以便您可以监控 CPU、磁盘使用情况或正在运行的容器的整体运行状况指标:
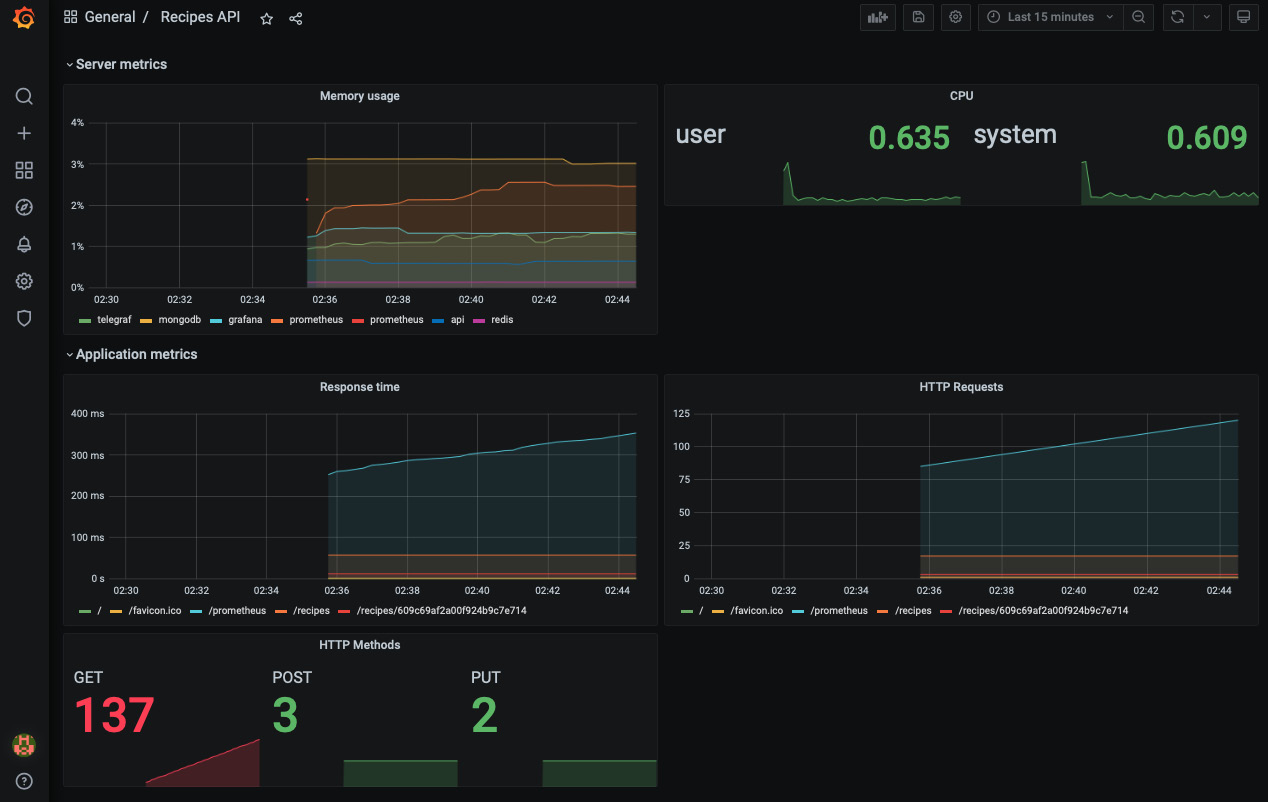
图 10.19 – 服务器端和应用端指标
做得好!现在,您在最短的时间内拥有了一个漂亮的交互式仪表板。
Creating a Grafana notification channel
在上一章中,您了解了如何使用 Slack 提高对 CI/CD 状态的认识,以便团队立即采取行动。当达到某个阈值时,您可以通过在 Grafana 仪表板上配置 Slack 警报来监控 Gin 应用程序时使用相同的方法。
在 Grafana 仪表板中,点击 Alerting 图标,然后点击 Notification channels。单击添加频道按钮并将类型更改为Slack。然后,输入一个 Webhook URL:
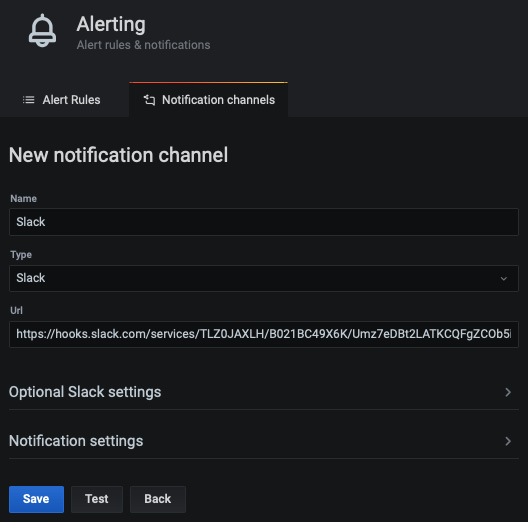
图 10.20 – 配置 Slack 通知通道
笔记
有关如何创建 Slack 应用程序和生成 Webhook URL 的分步指南,请查看 第 9 章< /a>, 实现 CI/CD 管道。
要测试配置,请单击测试按钮。您应该在配置的 Slack 频道中收到类似于以下内容的消息:
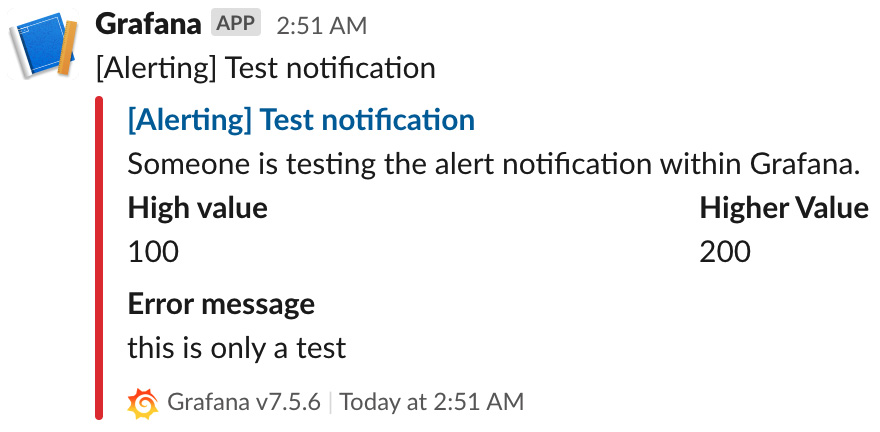
图 10.21 – 来自 Grafana 的 Slack 测试消息
现在您有了 通知渠道,您可以在仪表板面板上创建警报规则。例如,在您之前创建的 HTTP 请求 图表上创建一个警报规则,然后在 通知 部分中选择通知渠道。规则如下所示:
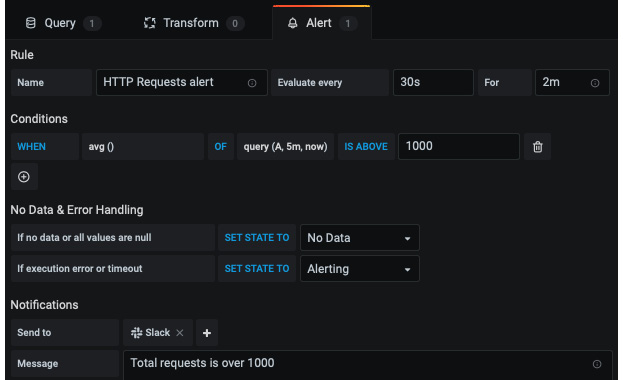
图 10.22 – 在 Grafana 中创建警报规则
每 30 秒,Grafana 将评估 HTTP 请求的平均数量是否超过 1,000 个请求。如果指标违反此规则,Grafana 将等待 2 分钟。如果 2 分钟后指标仍未恢复,Grafana 将触发警报并发送 Slack 通知。
要测试警报规则,您需要生成工作负载。您可以使用Apache Benchmark通过以下命令将1,500个请求并行发送到Recipes API:
此处,/recipes 端点的请求数将超过 1,000 个阈值,如下图所示:
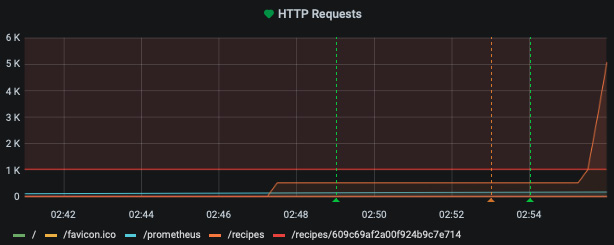
图 10.23 – 达到 1,000 个请求的限制
2 分钟后,将触发警报,您将在 Slack 频道上看到以下消息:
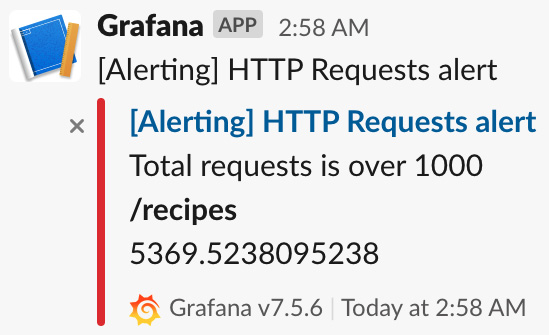
图 10.24 – Grafana 的 Slack 警报
笔记
设置指标警报的另一个选项是使用 Prometheus Alertmanager (https://prometheus.io/docs/alerting/latest/alertmanager)。
拥有 Slack 通知 可以帮助您在生产环境中出现严重错误之前立即采取行动。
Streaming Gin logs to the ELK platform
在部署Gin Web应用程序时需要关注的另一个有益方面在生产中是日志。日志可以帮助您找到应用程序性能不佳或崩溃的根本原因。
但是,日志可能是冗长的和垃圾邮件——这就是为什么您需要一个集中的平台来应用过滤器并保持 关注重要事件。这就是解决方案如Elasticsearch、Logstash和Kibana (ELK) 需要。以下架构说明了如何实现这样的解决方案:
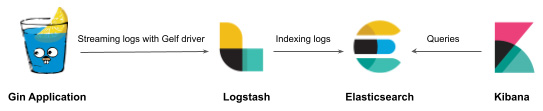
图 10.25 – 将 Gin 日志流式传输到 ELK
Gin 应用程序日志将使用 Docker GELF 驱动程序 (https://docs.docker.com/config/containers/logging/gelf/)。从那里,Logstash 将处理 传入日志并将它们存储在 Elasticsearch 中。最后,可以通过交互式仪表板在 Kibana 中可视化日志。
Deploying the ELK stack with Docker
到目前为止,您应该熟悉 Docker 并能够使用它来使用 Docker Compose 部署 Dockerized ELK 堆栈。为此,请按照下列步骤操作:
- Start with Logstash. Add the following YAML block to
docker-compose.yml. The container uses the latest Docker image v7.12.1 (at the time of writing this chapter): - The container uses a
logstash.confwith the following content: - Next, deploy the second component responsible for storing and indexing incoming logs. Elasticsearch can be deployed in a single-node mode with the following configuration:
笔记
对于生产使用,强烈建议以具有多个数据节点的集群模式部署 Elasticsearch,以实现高可用性和弹性。
- Then, deploy the third component to visualize the incoming Gin logs in an interactive way. The following YAML block is responsible for deploying Kibana:
您的 ELK 堆栈现已配置完毕!
配置 ELK 堆栈后,您需要将 Gin 应用程序日志流式传输到 Logstash。幸运的是,Docker 有一个支持 Logstash 的内置 GELF 驱动程序。要将 Gin 应用程序日志流式传输到 Logstash,请应用以下步骤:
- Add the following
loggingsection to the Recipes API YAML block: - Redeploy the entire stack with
docker-compose up –d. You can check whether all the services are up and running by running thedocker-compose pscommand:
图 10.26 – 正在运行的 Docker 服务列表
笔记
确保为 Docker 引擎分配了至少 4 GiB 的内存。在 Docker Desktop 中,您可以在 Preferences 中配置 Advanced 选项卡的资源使用情况。
- Then, point your browser to
localhost:5601. You should be welcomed with the Kibana dashboard:
图 10.27 – Kibana 欢迎页面
- Next, click on Add data and select Elasticsearch logs as a data source:

图 10.28 – 从 Elasticsearch 添加数据
- Click on Create index pattern and type
containers-*in the Index pattern name field. The asterix is used to include all the logs coming from Logstash. Then, click on the Next step button:
图 10.29 – 创建索引模式
- Select
@timestampas the primary time field to use with the global time filter. Then, click on Create index pattern:
图 10.30 – 为日志配置时间戳字段
在随后的页面上,您应该会看到一个列表,其中包含
容器< /代码>索引:
图 10.31 – 容器索引中的可用字段列表
- With Elasticsearch being connected with Kibana, click on Discover from the sidebar in the Analytics section. You should see a stream of logs coming from the Gin RESTful API:

图 10.32 – Kibana 中的 Gin 日志
笔记
对于生产使用,您可以使用 curator 工具 (https:// www.elastic.co/guide/en/elasticsearch/client/curator/index.html)从 Elasticsearch 中删除早于 X 天的索引。
- Expand a row from the list of logs.
您应该看到 Gin 应用程序日志存储在一个名为 message 的字段中:
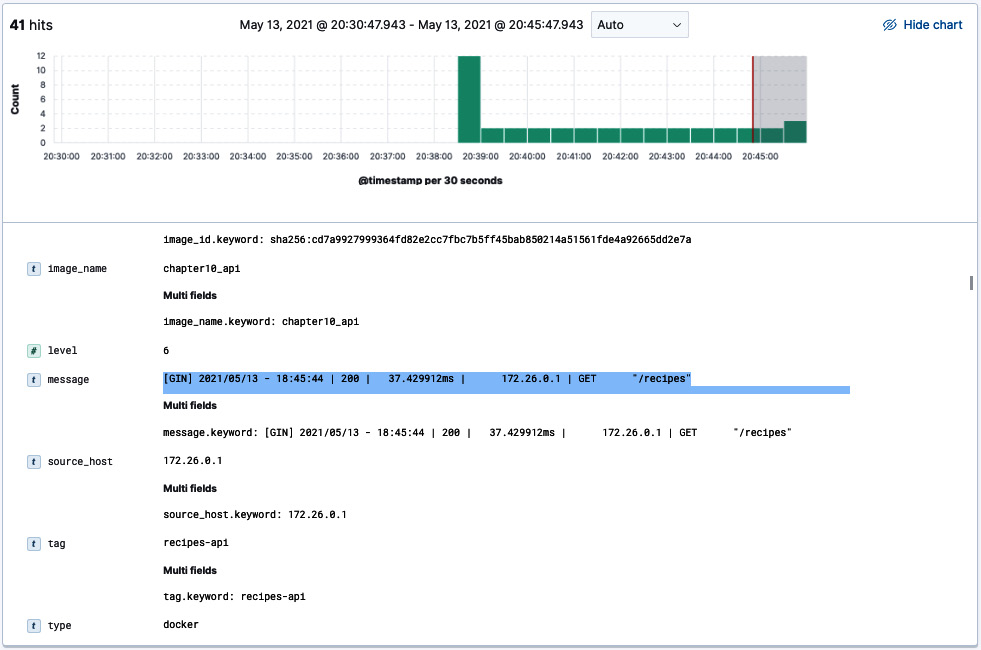
图 10.33 – 消息字段内容
现在,您有一个读取 Gin 日志的工作管道。但是,您会注意到日志消息的格式并不理想。您可以解析该字段,并使用 Grok 表达式将重要信息拆分为多个字段。
Writing Grok expressions
Grok 表达式通过使用正则表达式解析文本模式并将它们分配给标识符来工作。语法是 %{PATTERN:IDENTIFIER}。我们可以编写一系列 Grok 模式,并将以下日志消息的各个部分分配给各种标识符:
Grok 模式如下:
笔记
Grok 带有自己的模式字典,您可以开箱即用。但是,您始终可以定义自己的自定义模式。
您可以使用 Dev Tools 上的 Grok 调试器 功能测试模式 页。在 Sample Data 字段中,输入上一条消息,在 Grok Pattern 中,输入 Grok 模式。
然后,点击模拟;您将看到应用 Grok 模式产生的模拟事件:
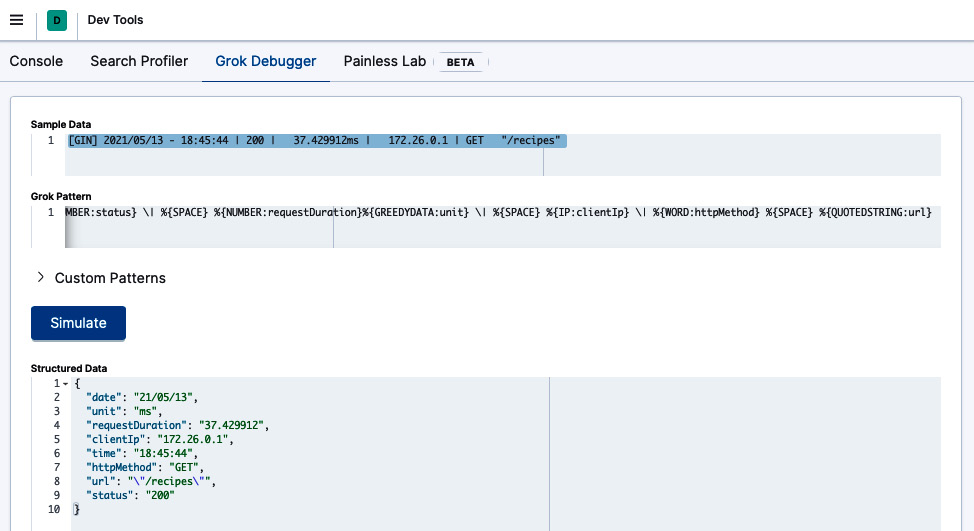
图 10.34 – 将 Grok 模式应用于样本数据
笔记
如果发生错误,您可以继续迭代自定义模式,直到输出与您期望的事件匹配。
现在您已经有了 工作 Grok 模式,您可以在 Logstash 级别应用解析。为此,请更新 logstash.conf 文件,使其包含过滤器部分,如下所示:
现在,如果您重新启动 Logstash 容器,则应解析传入的日志并将其拆分为多个字段:
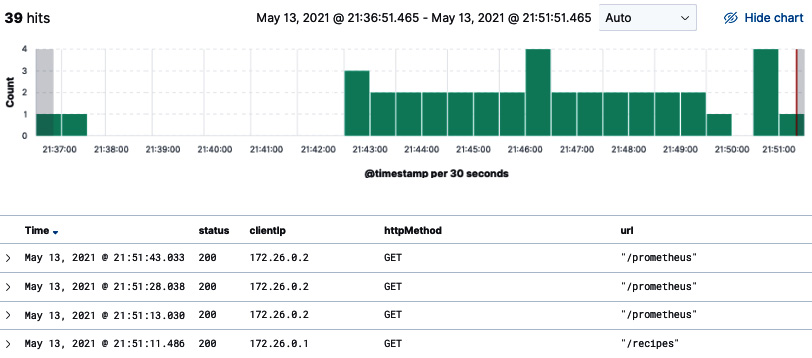
图 10.35 – 消息字段拆分为多个字段
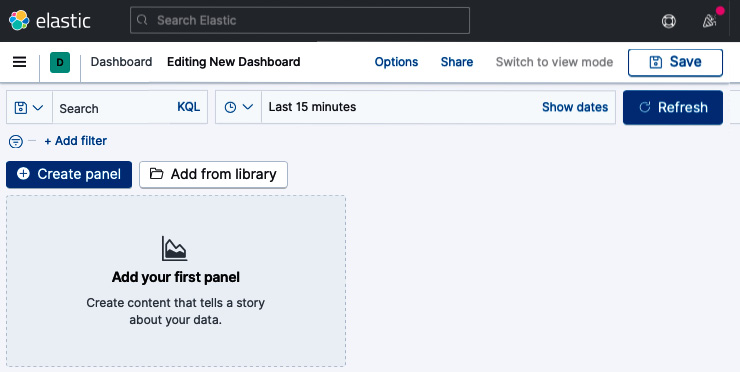
图 10.36 – 创建一个新的 Kibana 仪表板
将 status.keyword 字段拖放到面板中。然后,选择一个堆积条形图表。你应该得到下面的图表,它代表了每个 HTTP 状态码的请求数:
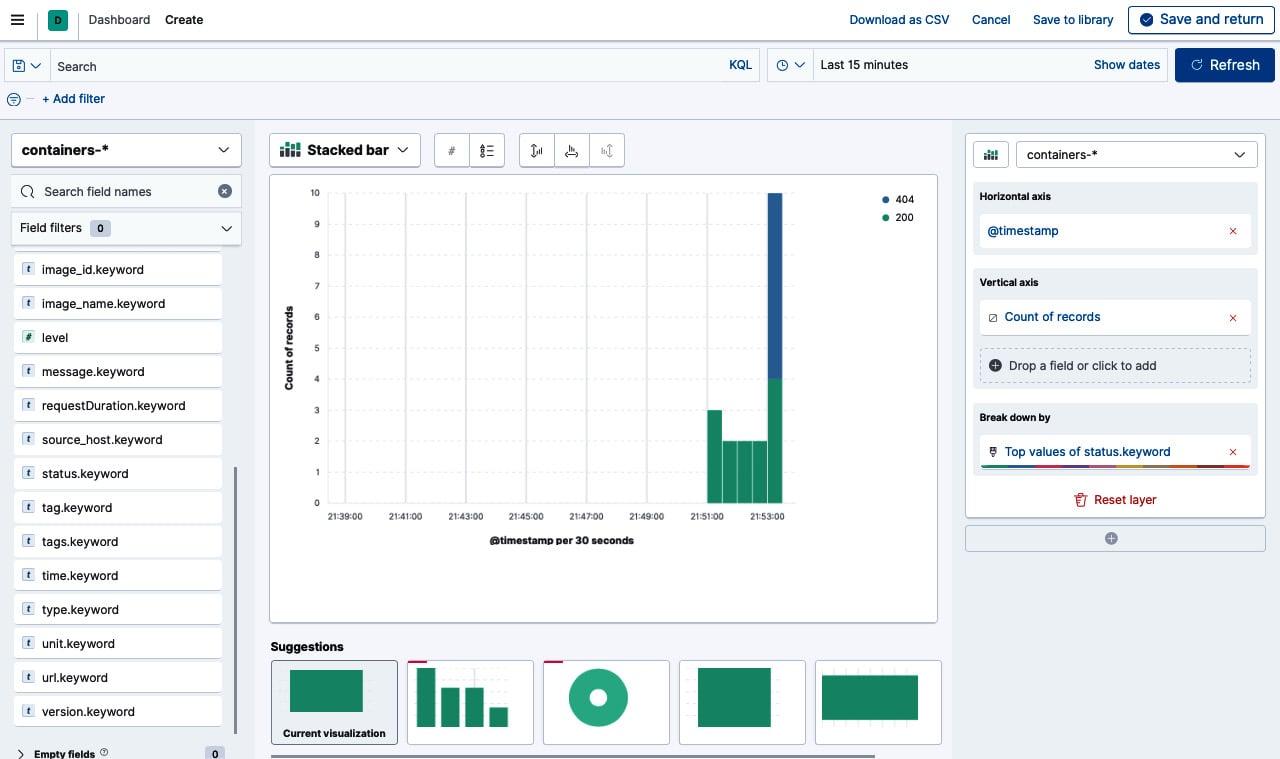
图片 10.37 – 使用 Kibana 图表构建器构建图表
您可以将堆叠条形图保存为小部件并将其导入仪表板。使用仪表板,您可以将多个可视化组合到一个页面上,然后通过提供搜索查询或通过单击可视化中的元素来选择过滤器来过滤它们。当您想要了解 Gin 应用程序日志并在各种可视化和日志之间建立关联时,仪表板非常有用。
Updating the Gin logging format
默认情况下,Gin 将每个请求字段记录到标准输出(stdout) ,这对于解决和调试 HTTP 请求错误非常有用。但是,这对于其他开发人员来说可能过于冗长,他们很容易迷失方向并错过重要事件。幸运的是,您可以通过创建自定义日志格式化程序来覆盖此默认行为。
要使用 Gin 创建自定义日志格式,请从以下代码块开始:
该代码将记录 请求时间戳、HTTP 方法、路径、状态代码和持续时间:
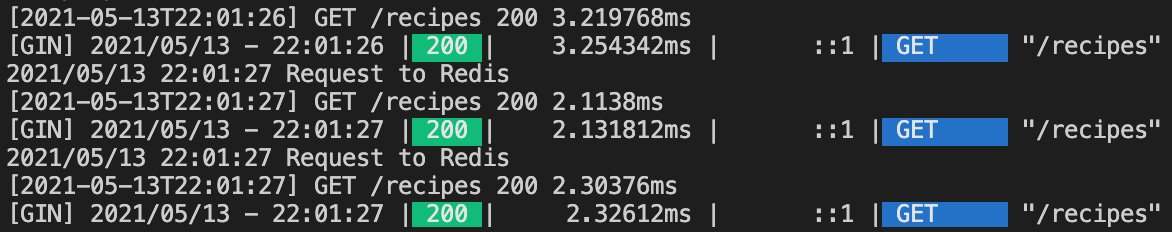
图 10.38 – Gin 自定义日志格式
默认情况下,Gin 会将所有日志输出到 stdout,但是您可以通过使用以下命令将 GIN_MODE 设置为释放模式来禁用它们:
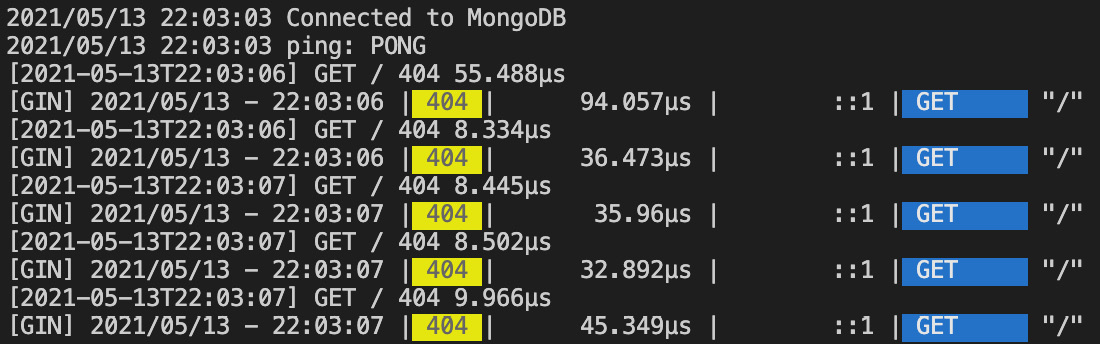
图 10.39 – 在发布模式下运行 Gin
您还可以使用以下代码块覆盖日志目标,使其成为文件而不是 stdout:
因此,应该在应用程序日志旁边创建一个名为 debug.log 的新文件:
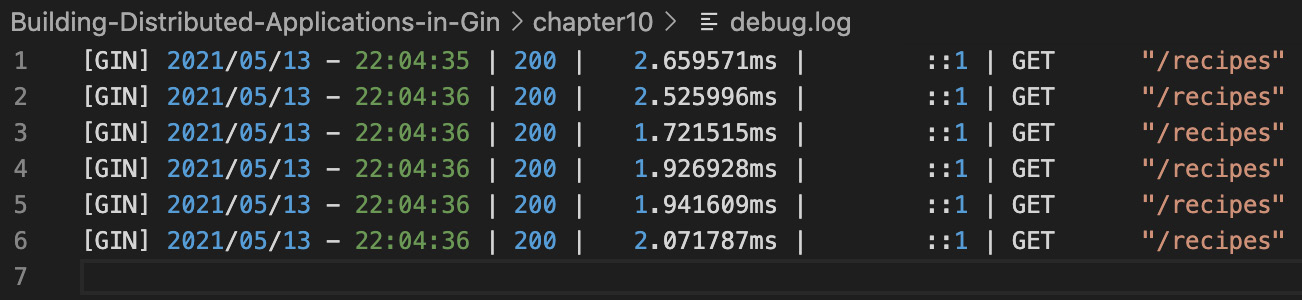
图 10.40 – 将日志流式传输到文件
您可以使用 Filebeat 将文件的内容流式传输到 Elasticsearch。 Filebeat 可以用作 Logstash 的替代品:
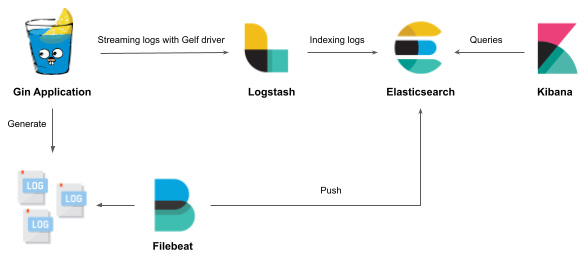
图 10.41 – 使用 Filebeat 将日志文件发送到 ELK
将 后面的 YAML 块添加到 docker-compose.yml 以部署基于 Filebeat v7.12.1 映像的容器:
容器将在 /usr/share/filebeat 中查找配置文件。配置文件是通过绑定挂载提供的(参见 volumes 部分)。该文件的内容如下。它将侦听来自 /var/log/api/debug.log 的日志并回显 Elasticsearch 接收到的任何日志:
使用 docker-compose up –d 命令重新启动堆栈。正在运行的 Docker 服务列表如下:
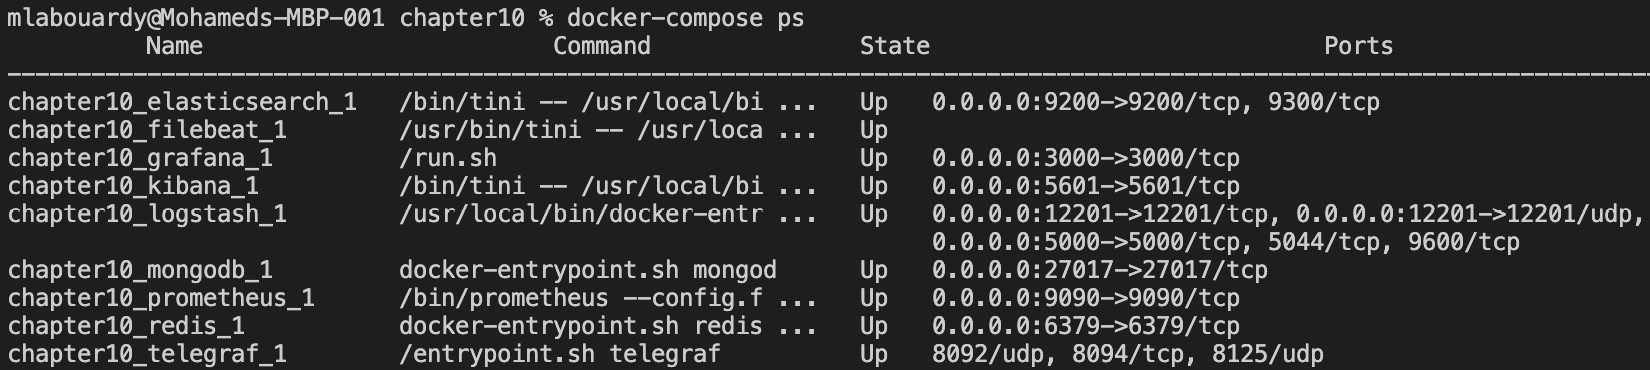
图 10.42 – Filebeat 作为 Docker 容器运行
向 Recipes API 发出一些请求。此时,Gin 会将日志转发到 debug.log,Filebeat 会将它们流式传输到 Elasticsearch。从那里,您可以在 Kibana 中实时可视化它们:
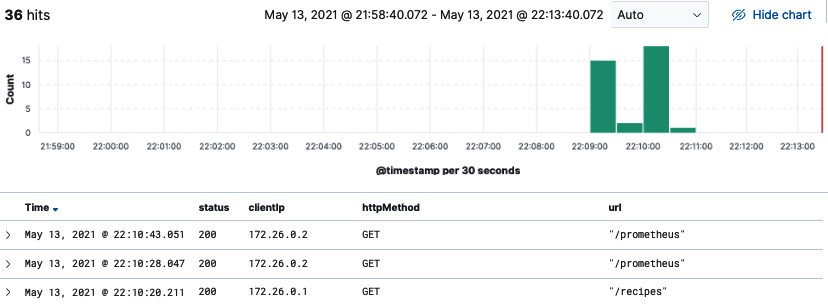
图 10.43 – 可视化来自 Filebeat 的日志
伟大的!您现在可以使用 Kibana 仪表板实时分析 Gin 日志。分析这些日志可以提供大量信息,有助于解决 Gin 应用程序故障的根本原因。
Summary
在本章中,您学习了如何使用 Prometheus 检测 Gin 应用程序代码以公开应用程序端指标。您了解了如何使用 Grafana 构建动态仪表板以近乎实时地监控 Gin 应用程序的整体运行状况,以及如何在超过某些阈值时触发 Slack 警报。
然后,您学习了如何将 Gin 日志流式传输到使用 Logstash、Elasticsearch 和 Kibana 等开源工具构建的集中式日志平台。在此过程中,您学习了如何使用 Grok 模式解析 Gin 日志,以及如何在这些解析的字段之上构建图表。
恭喜!现在,您可以从头开始设计、构建和部署分布式 Gin 应用程序。在如何自动化部署工作流程和监控生产中运行的 Gin 应用程序方面,您也有坚实的基础。
Conclusion
我们正在阅读这本书的旅程的终点!你已经做到了最后。我希望你为你所经历的旅程感到自豪。您已经了解了 Gin 框架的来龙去脉,并组装了一个功能齐全的分布式 Gin 应用程序。
到目前为止,您应该知道构建可扩展的 Dockerized Gin 应用程序所需的所有知识,从使用 GitFlow 处理多个 Git 分支到使用 CI/CD 管道在 AWS 上自动构建、近乎实时的故障排除和监控,以及使用 OpenAPI 生成 API 文档。
这本书有很多东西要吸收和学习,特别是如果这是你第一次接触 Gin 框架。我发现最好的学习方法是边做边学,所以请使用您构建的 RESTful API 并向其中添加新功能。如果你确实建造了一些东西,请联系我并告诉我你做了什么。